A Pamphlet from Don Stuart, Preserve Our Nation, LLC
Pamphlet #35 - 5/18/2012
Pass this pamphlet to your friends!
Donate to Our Cause
"If Not Now, Then When?"
Capitalism (Economic Liberty) versus Social Justice (Economic Justice)
Looking back over the past 50 years of our Nation's path reveals consequential questions...
|
Think about the following questions and then consider the alternatives in light of “If Not Now, Then When?”
|
If we had accomplished the above three points, we still could have spent all the money on the “Great Society” social programs of economic justice and our nation would be much better off today. Economic justice distorts the free market, hampering innovation and growth. To try to plan the lives of people, per economic justice, is to believe that government can manipulate the free market. This results in a less efficient economy; and, a less efficient economy results in less freedom.
This pamphlet is a warning to citizens that delay of corrective action is dangerous. The dangers of the liberal policies will forever financially imprison future generations and dilute their freedoms for many generations to come. Be forewarned.
The big question is "Just how much better off would we be today?" Continue reading to find out.
|
“We all want progress, but if you're on the wrong road, progress means doing an about-turn and walking back to the right road; in that case, the man who turns back soonest is the most progressive.” C. S. Lewis |
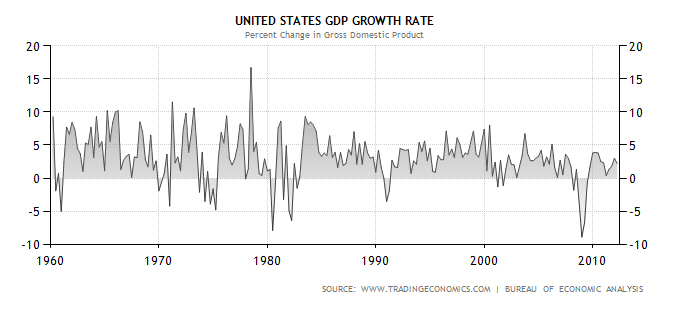
The following graph shows the changes in GDP over the past 50 years.
The results of "Just how much better off would we be today?" are discussed below using the following graphs.
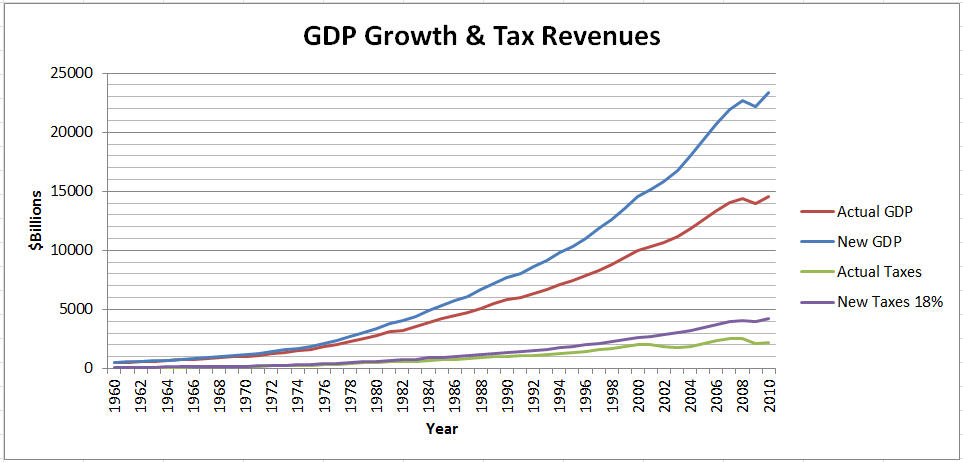
A 1% increase in GDP (PIE) each year would have resulted in:
|
Based on the above GDP and Tax Revenues, results would have yielded the following amounts of accumulated new revenues.
The resulting amounts of new tax revenues would be:
|
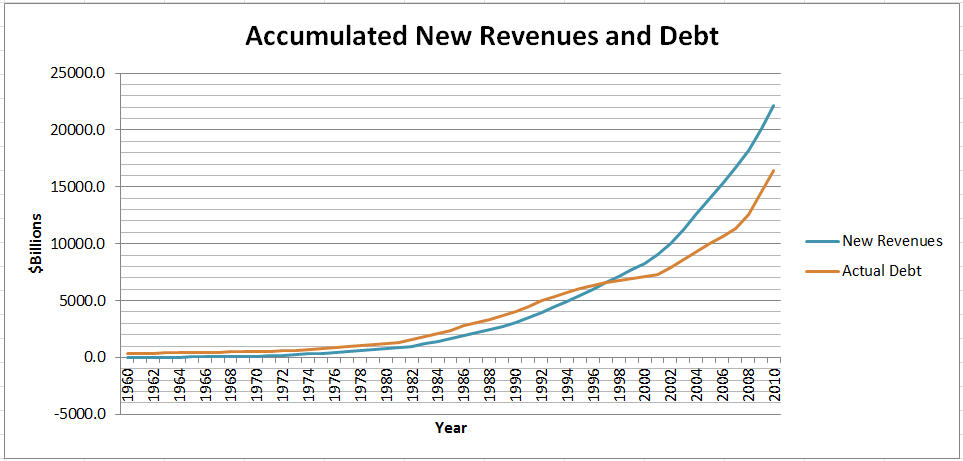
If we continue for the next 50 years as we have for the past 50 years, the “Next Generations” will never be able to pay off the current debt and the ever increasing debt.
|
“Our country is now taking so steady a course as to show by what road it will pass to destruction, to wit: by consolidation of power first, and then corruption, its necessary consequence.” Thomas Jefferson |
We need to make a major change in the economy to give hope to the “Next Generations.”
What can we do to reduce the debt to zero in the next 20 years while fulfilling our obligations to education, Medicare, Medicaid, seniors, military veterans, those on welfare and those in poverty? The answer is we need to generate a 7.5% annual increase in the GDP (PIE) for 10 years: this would result in doubling the GDP (PIE) to $28-$30 Trillion over that 10 year period. In addition, we need to reduce the spending to manageable levels by implementing long term goals and plans for current spending programs.
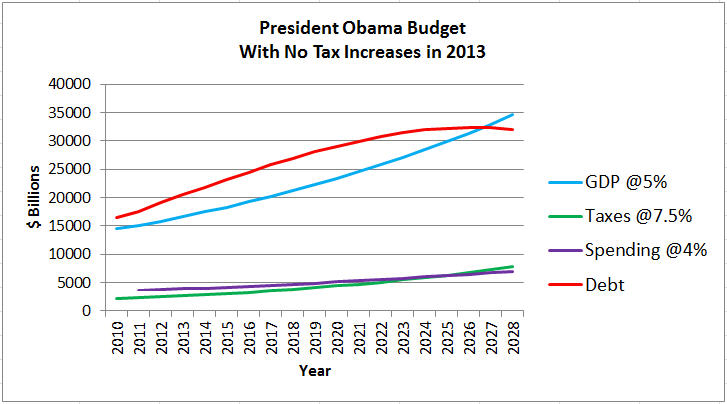
The President’s latest 10 year budget forecasts a 5% annualized growth in GDP (PIE), a 7.5% annualized growth in tax receipts and a 4% annualized growth in spending. This budget results in a $15 Trillion debt growing to $21 Trillion debt over 10 years. This budget forecast is an even worst scenario than that of the “past 50 years.”
The following three sets of graphs will illustrate the President’s 10 year budget. The first graph of each set shows the GDP (PIE), Taxes, Spending and Debt. The second graph of each set shows the percent of GDP (PIE) for each of Taxes, Spending and Debt. The first set of graphs assume no new tax revenues in 2013, the second set of graphs assumes that all existing tax deductions/extensions are cancelled in 2013 for a $362 Billion increase in tax revenue. The third set of graphs assumes a $1 Trillion increase in tax revenue in 2013.
First Set of Graphs
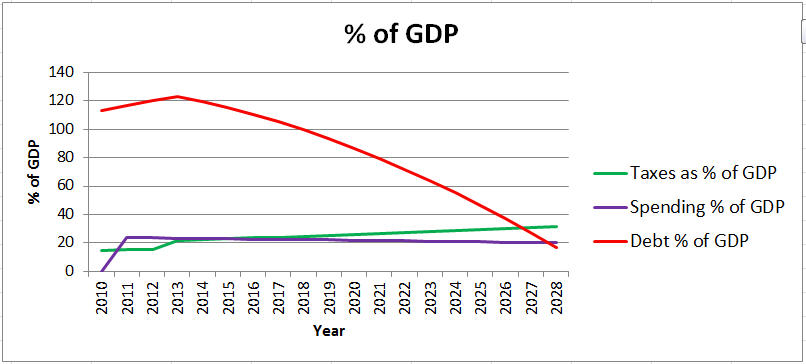
The following graph shows the results of the President’s Budget with no tax increases in 2013.
The following graph shows the percent (%) of GDP (PIE) for taxes, spending and debt for the above chart.
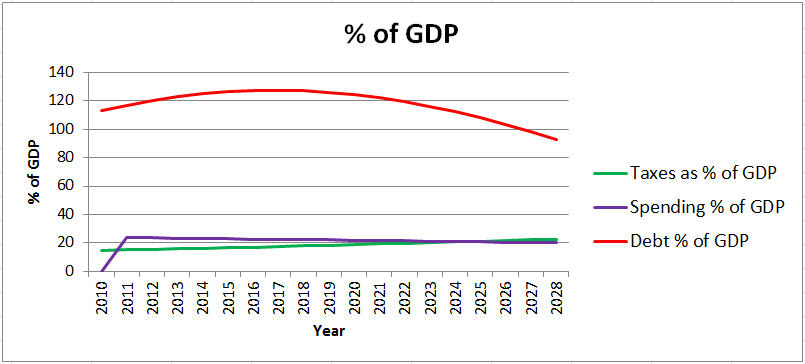
With no tax increases in 2013 the debt continues to rise for the next 14 years and reaches a maximum of $32 Trillion. During that period, the debt rises to 127% of GDP and in 2028 the debt will be 93% of GDP, Tax Revenue is 23% of GDP and Spending is 20% of GDP. The debt is paid off in 2040.
Second Set of Graphs
If the President gets all the tax increases in 2013 the following two charts shows the results. The assumption is that the taxes increase by $362 Billion in 2013 and they grow by the 7.5% annually.
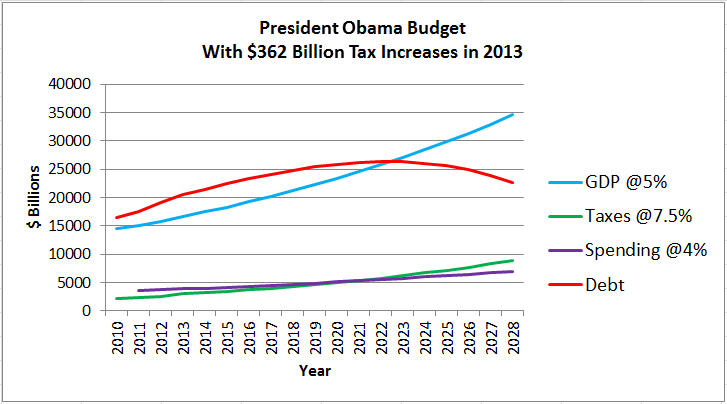
The following graph shows the percent (%) of GDP (PIE) for taxes, spending and debt for the above chart.
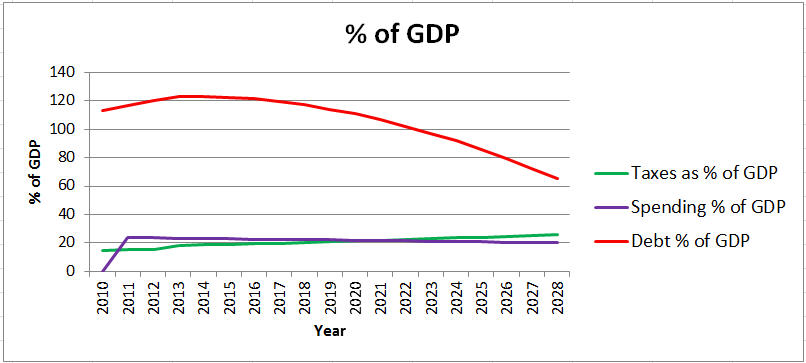
With the tax increases in 2013 of $362 Billion, the debt rises to $27 Trillion in 2023 and falls to $23.5 Trillion in 2028. In 2028, the debt is 68% of GDP, Tax Revenue is 26% of GDP and Spending is 20% of GDP. The Debt is paid off in 2036.
To achieve a $362 Billion increase in taxes in 2013 it would take more than all the proposed new taxes, including new taxes on small businesses, allowing the Bush tax cuts to expire and allowing the AMT tax to increase.
Third Set of Graphs
If the President gets major tax increases in 2013 the following two charts shows the results. The assumption is that the taxes increase by $1 Trillion in 2013 and they grow by the 7.5% annually.
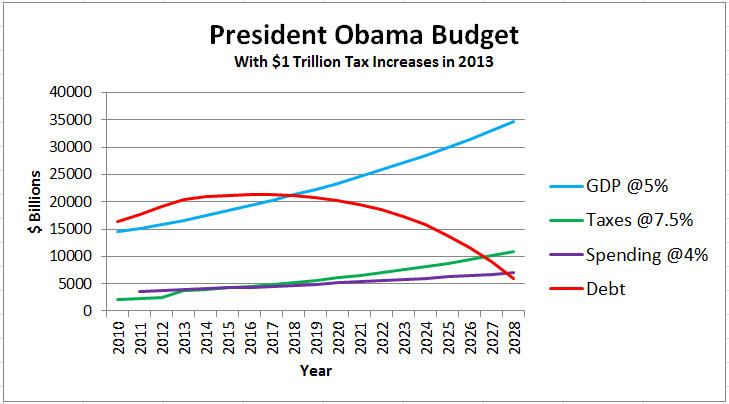
The following graph shows the percent (%) of GDP (PIE) for taxes, spending and debt for the above chart.
With the tax increases in 2013 of $1 Trillion, the debt rises to $25 Trillion in 2018 and falls to $13 Trillion in 2028. In 2028, the Debt is 39% of GDP, Tax Revenue is 31% of GDP and Spending is 20% of GDP. The debt is paid off in 2031.
To achieve a $1 Trillion increase in taxes in 2013 would take more than all the proposed new taxes, including new taxes on small businesses, allowing the Bush tax cuts to expire, allowing the AMT tax to increase and increasing the personal income tax rates. In fact, it would take a tax rate of 93% of all earning above $200,000 to reach a $1 Trillion in new tax revenue. This is the Progressive Liberal’s ultimate dream of “Redistribution.”
These are very unrealistic scenarios. Remember that the President’s 10 year Budget scenario forecasts a 5% annual GDP (PIE) growth, a 7.5% growth in tax receipts and a 4% growth in spending.
The first set of graphs, with no tax increase, would take 30 to 40 years to achieve the goal of freeing the “Next Generations.” The second set of graphs with $362 Billion tax increases would take 25 to 35 years to achieve the goal of freeing the “Next Generations.” The third set of graphs with $1 Trillion tax increases would, in fact, achieve the goal of freeing the “Next Generation” in 21 years to 25 years.
However, all of these scenarios would never be achieved because Capitalism would be killed. Would the GDP really increase by 5% a year while at the same time killing Capitalism and the Free Market? A more realistic GDP growth would be 2%-3% resulting is less tax revenues and extending the period to eliminate the debt forever.
|
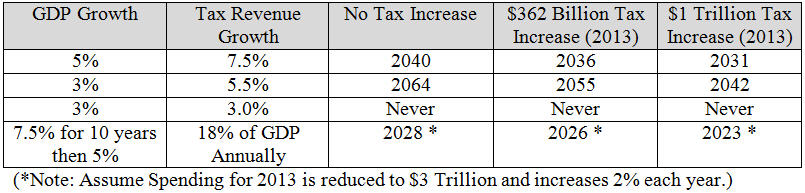
The following chart shows the years the debt will be paid off. The first row is the President’s 10 year budget criteria: 5% GDP growth, 7.5% tax increase and 4% spending increase. The second and third rows are modification of the President’s Budget. The bottom row illustrates the 7.5% GDP growth for ten years followed by 5% growth. |
Our only solution to increase the GDP is by allowing Capitalism and the Free Markets to work! We can achieve economic liberty again!
|
“The best road to progress is freedom's road.” |
Find out what we must do to accomplish these goals. Then consider supporting us by committing to a re-occurring monthly contribution of $25 per month to help achieve these goals.
Learn what you can do to help save our Nation! Visit our Website Home Page!
| DONATE TODAY! |
|