A Pamphlet from Don Stuart, Preserve Our Nation, LLC
Pamphlet #44 - 12/3/2016
Pass this pamphlet to your friends!
Donate to Our Cause
Join Our Email List!
Pass this pamphlet to your children.
They need to know the truth about what our generation
is leaving them .
Give your adult children a chance to choose their own future.
Download This Pamphlet - pdf Version
Part 2: Economic and Debt Reduction Message
 |
 |
 |
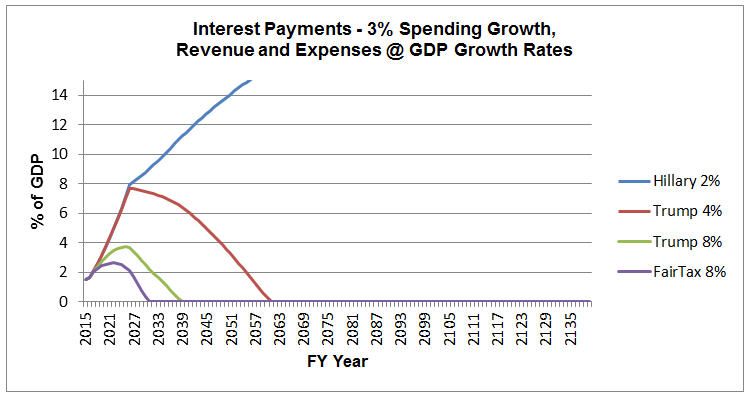 |
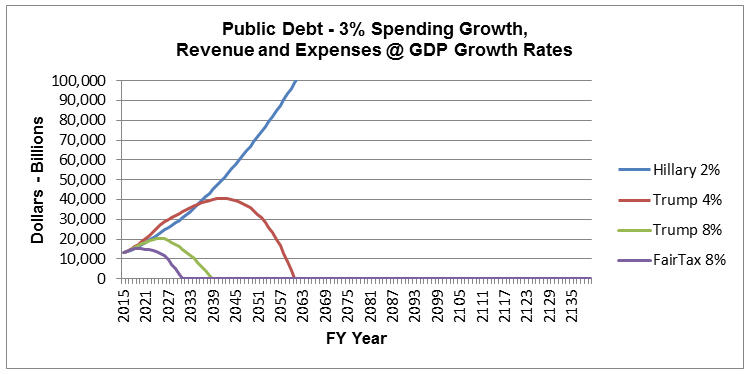
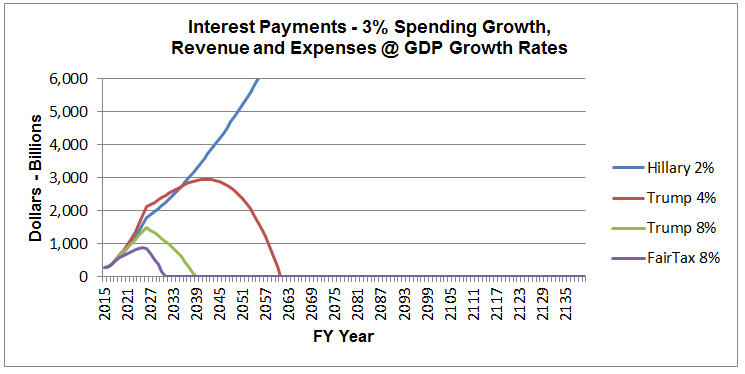
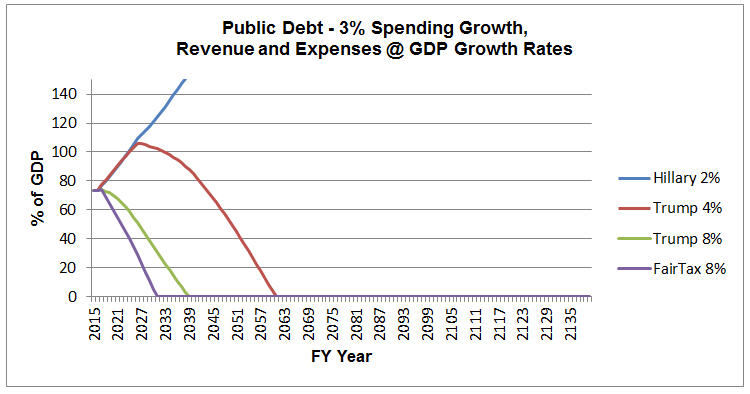
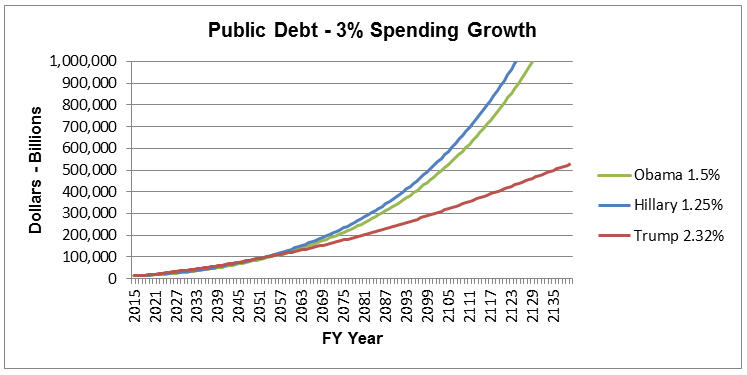
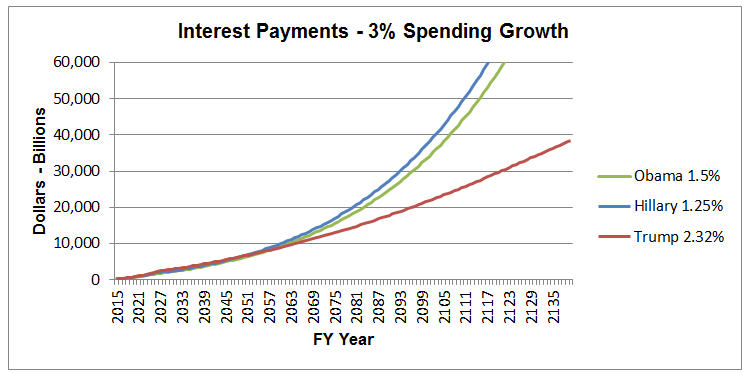
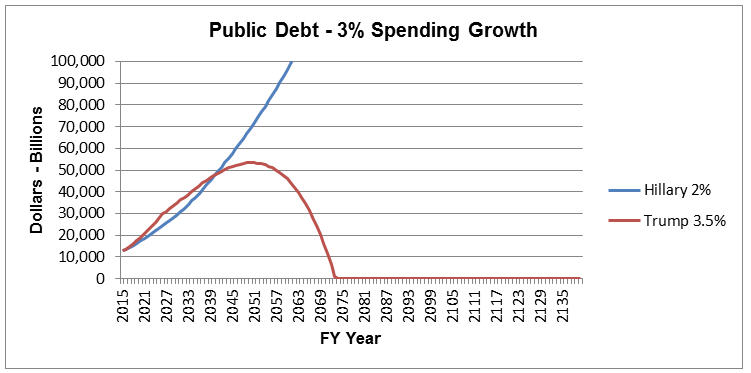
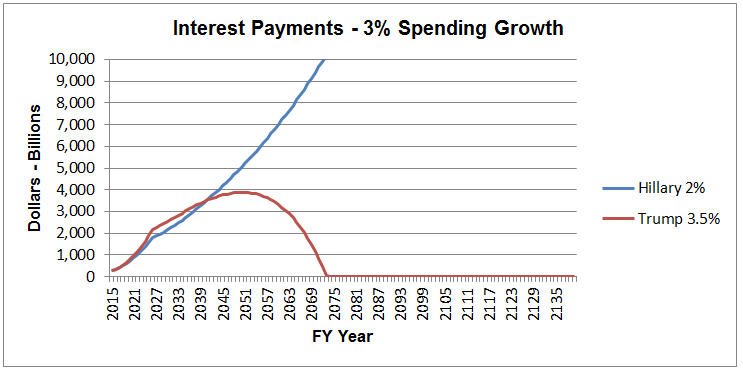
The above charts show the future paths of the National Debt and the Interest Payments on that Debt. Note the dates when the Debt will be paid off under the different paths.
Note the high points of the graphs for Trump’s 4% GDP growth path forward: Maximum Debt is $40.5 Trillion in 2042 and Maximum Debt Interest is $2.95 Trillion in 2042. This is assuming that Trump can achieve 4% growth for 8 years and it continues for the next 25 years.
Continue reading to review my assumptions for this analysis and see additional charts.
Our Only Goal: Children are Our Most Important Product.
Children are our only lasting product we will produce. All other products are only immediate needs. We are only here in this world for a fleeting moment; some say a “Flicker”. Our Children and their Children are our lasting vision for the future of the world.
| Point: |
The American Dream is to build a better future for our children. |
The American Dream is not about us, it is about our children and their future. I live and work for God, Family and Country. Our children are the reason our Nation exists.
What is crushing the American Dream and the future for our children? Its GDP growth and the existing and continuing National Debt.
The Debt
The election is over, so let’s take a review and look at the future of our children. No one wants to talk about the Debt!
Debt is a very real issue for our children. Not only is paying the Debt principle a problem but the growing interest payments will swallow the future economy. We don’t want to waste their money on paying off the Debt and Interest.
While shouldering this Debt load, will our children and their children and their children be able to pursuit the American Dream?
We are saddling our children and their children and their children with repaying the principle and paying the interest on the debt that we have accumulated. The interest payment on the Debt takes money away from businesses wanting to expand, hiring more workers and providing investment for research and new technologies. Higher interest payments on the Debt yields lower GDP growth. With increasing interest rates, the debt payments would easily exceed the amount we spend on the Military Spending in the Budget.
Our debt is off the scale and the most important goal is to get us on a path of paying off the $19 Trillion plus debt and fast growing debt. (Note: approximately $15 Trillion of the Debt is Public and the rest, $4.5 Trillion is Treasury Debt. Interest is paid only on Public Debt.)
As I said the election is over and Trump won. This analysis is a review of the Debt based on the assumptions from the campaign and the future. But let’s look at what our choice was and what the future under Trump and Republicans will look like.
I’ll start looking at the following propositions. What would the Debt look like in these future projections?
| Charts | Description (Propositions) | ||||
| 1 |
|
||||
| 2 |
|
||||
| 3 |
|
2017 - 2026 CBO Projections
|
The current CBO projection is that for the next ten years without any changes via Hillary or Trump, the economy will grow less than 2%, spending will increase more than 3% per year, mostly due to mandatory spending. Under this scenario, the 2026 Public Deficit will exceed $1 Trillion and the Debt will be 86% of GDP and the accumulated Public Debt will be $18 Trillion, up from $14 Trillion in FY 2015. Under this scenario, the FY 2026 interest on the public Debt will rise above $400 Billion (approximately 2% of GDP) with annually increases forever. The current low Federal Funds Rate hides the fact of the higher Debt Interest payments are looming in the future. |
| Point: |
But most important is the fact that under these conditions the Debt will never be paid off and the interest payments will continuously rise beyond sustainable limits. |
Static Analysis Assumptions
My projections of the future GDP (Gross Domestic Product), Tax Revenues, Government Spending and interest rates (Federal Funds Rates) are static assumptions, that is, I have assumed that for the next ten years calculations have been spread out evenly over the period. This is not a modeling program that would include many areas of the economy, the elasticity of revenue, spending, investment, etc…This analysis also assumes that Debt Interest payments will COMPETE within the budget for Discretionary and Mandatory spending.
These assumptions are only to illustrate how the Debt will grow, when the Debt will be paid off and what will be the annual Interest payments on the Debt. In all tables, I concentrate on the data for FY 2026, ten years down the road. The CBO projections above also use the same ten year period.
Federal Fund Rate Assumptions
It is expected that the Interest Rates will rise over the next 10 years based on the Federal Reserve’s (FED) policy. I am assuming that the FED will raise basis points such as to raise the rate 0.5% per year for several years until interest rates reach approximately 6%. My analysis assumes this will happen over the next 10 years.
Spending Assumptions
As projected by the CBO, I am projecting that basic spending will increase by 3% per year to cover mandatory spending. I reduce the spending increasing to 2% beginning in 2036 in the assumption that the Baby Boomers will have died and Social Security and Medicare increases will fall.
In Hillary’s analysis, I am assuming per her campaign and Tax Foundation that she will spend an additional $350 Billion per year over the next ten years. These were not broken down for analysis but revealed as a total spending which I divided evenly over ten years.
In Trump’s analysis, I am assuming the following spending categories:
- Military Spending: The military spending has historical been approximately 6% of GDP but is currently only 3% of GDP. I am assuming that Trump will raise this back up to 6% of GDP over the next ten years.
- Infrastructure Spending: Instead of a one stimulus spending package I have spread the spending our over the next five (5) year and eight (8) year increments. There has been talk of a $1 Trillion Infrastructure spending stimulus but I consider that this will be broken into two separate parts: This provides a total of Infrastructure spending of $610 Billion plus $452 Billion via the tax credits. That’s a total of $1,062 Billion over eight years.
- Direct Infrastructure spending by Government:
- Indirect Infrastructure spending via Private industry of $16 Billion ($2 Billion per year Tax Credits for eight (8) years). This will generate $452 Billion of infrastructure projects.
- Southern Border Wall: I have projected it will cost $25 Billion to build the wall and another $25 Billion per year for maintenance for the Wall. I have allocated $25 Billion per year for ten (10) years.
- Child Care: I have allocated $10 Billion per year for ten (10) years to cover additional Child Care.
- School Choice: I have allocated $10 Billion per year for ten (10) years to provide school choice for children in low performing schools.
i. $305 Billion ($61 Billion per year for five (5) years). This has been approved.
ii. $305 Billion ($38 Billion per year for (8) years). Congress is working on increasing the total for both to $610 Billion.
Revenue Assumptions
Currently the revenue of the Obama Administration is 17.5% of GDP and I use this for the Obama revenue projections while the GDP is projected to increase 1.5% per year.
The Tax foundation provided a single GDP growth over the next ten years for both the Hillary and Trump Presidencies. I divided their GDP growths so as to split into ten evenly growth period: Hillary’s GDP growth is 1.25% per year and Trump’s GDP growth is 2.32% per year.
For the Revenue calculations, I used data from their campaign for both Hillary and Trump: Hillary at 18.05% of GDP and Trump at 14.88% of GDP. In addition, I included in 2018 one-time income generated by $2 Trillion of outsourced money returned and another $2 Trillion for underground money. This yields a 15.56% of GDP for FY 2018.
For the FairTax calculations, I used the same $2 Trillion above for outsourced money and underground money but slit it over 4 years of $1 Trillion per year.
The following charts illustrate the comparison of the propositions listed above.
The following charts illustrate the above data.
Tax Foundation Analysis
(0.5% Federal Funds Rate Growth)
(Obama: 1.5% GDP Growth, Current and future Growth with no additional spending)
(Hillary: 1.25% GDP Growth with proposed spending)
(Trump: 2.32% GDP Growth with proposed spending)
 |
 |
Campaign Data Analysis
(0.5% Federal Funds Rate Growth)
(Hillary: 2.0% GDP Growth with proposed spending)
(Trump: 3.5% GDP Growth with proposed spending)
 |
 |
FairTax Analysis
(0.5% Federal Funds Rate Growth)
(Hillary: 2.0% GDP Growth with proposed spending)
(Trump: 4.0% GDP Growth with proposed spending)
(Trump: 8.0%/4.0% GDP Growth with proposed spending)
(FairTax: 8.0%4.0% GDP Growth with Trump's proposed spending)
|
|
|
(Note: The CBO projection of spending is to be more than 3% per year.)
| Proposition |
| Consider the following questions! |
So the question is for Millennial (Generation Y – less than 36 year old) and the new following Generation Z (less than 22 years old):
“Which program is best for your future: Income Tax or FairTax?”
“Which is best for your children and grandchildren: Income Tax or FairTax?”
“Do you really want to pass this debt along to them?”
For the Millennial, in the next ten years will your career advance? For Generation Z, is there a job out there for you now or in the next ten years? Will your wages increase? Will your children be better off than you? Will you be better off than your parents?
In the 1960’s, Kennedy accomplished 5% annual economic growth for nine years by reducing taxes and maintaining a strong dollar. In the 1980’s, Reagan accomplished the same, reducing taxes and maintaining a strong dollar, to create over 4% annual economic growth for almost 20 years.
The next president must not only accomplish at least a 4% annual economic growth, but accomplish more in order to eliminate the Debt for our future generations.
FairTax Implementation
I believe that the President along with Congress can implement the FairTax and replace the Income Tax by just passing laws. In that laws do not exist for implementing the Income tax then it can be easily removed by setting all the bracket rates to zero.
Congress could also reduce the corporate tax rate to zero while the States vote to repeal the 16th Amendment. Congress should propose an Amendment to repeal the 16th Amendment that would then be put before the individual States for approval.
|
|
|
In simple terms, Consumption is taxed and Investments are not taxed. For our nation to grow and prosper, private investment is the driving force. By not taxing investments, this is an incentive for the public to save and invest more.
Wages are tied to corporate tax rates: higher rates yield lower wages; lower rates yield higher wages. Eliminating corporate taxes will remove this correlation then wages will be based on productivity.
We get no tax revenues on imported products. At least states get sales tax revenue. We receive no taxes from foreign employees producing the products. We get no tax benefit from imports except for a little from companies that sale and deliver the products.
That’s will change under the FairTax!
|
|
|
All this for taxes collected as Consumption Tax of approximately 23%.
|
|
|
Learn what you can do to help save our Nation! Visit our Website Home Page!
Download - pdf Version
| DONATE TODAY! |
|