A Pamphlet from Don Stuart, Preserve Our Nation, LLC
Pamphlet #43 - 09/28/2016
Updated 11/1/2016
Pass this pamphlet to your friends!
Donate to Our Cause
Join Our Email List!
Pass this pamphlet to your children.
They need to know the truth about what our generation
is leaving them .
Give your adult children a chance to choose their own future.
Download Tax Foundation Update - pdf Version
Part 1: Update to Debt Reduction Message
The Debt
Now, no one really wants to talk about the Debt!
The Tax Foundation has released an analysis of both Donald Trump’s and Hillary Clinton’s Tax Plans.
I reviewed the Tax Foundation analysis of both plans and found (in my opinion) the following categories in their tax plans.
| Items | Trump's Results | Hillary's Results |
| Total Categories | 19 | 18 |
| Increases Taxes | 2 | 12 |
| Decreases Taxes | 12 | 0 |
| Increases Tax Credits | 3 | 4 |
| Increases Private Investments | 2 | 0 |
| Decreases Private Savings | 0 | 1 |
| Decreases Business Deductible Expenses | 0 | 1 |
(Note: My OPINIONS)
(Note: Some Categories has two effects, but I only listed one.
Example: Increased Tax Credits could possible be Increased Taxes, but I listed as Tax Credits.)
Trump’s and Hillary’s Tax Plans both fail to do anything in the immediate or next 5 generations about the debt being passed forward. The following table shows a summary:
Tax Foundation Analysis
(FY 2017-2026 Ten Years)
| Items | Trump's Results | Hillary's Results |
| GDP | +8.2 % | -2.6 % |
| New Taxes (Static) | -$5,906 Billion | $1,427 Billion |
| New Taxes (Dynamic**) | -$3,932 Billion | $663 Billion |
| Capital Investment | +23.9 % | -7.0 % |
| Wage Growth | +6.3 % | -2.1 % |
| Job Growth | +2,155,000 | -697,000 |
(Note: See www.taxfoundation.org for details)
(Note: The Tax Foundation does not use dynamic scoring related to reduced regulations, trade deficits and energy costs.
These dynamic scoring do not recognize job growth and tax revenues which will make Trump's tax plan revenue neutral
while creating 25 Million plus jobs. This additional dynamic scoring of Hillary's plan would make her numbers even worst.)
As can be seen from the chart above, neither plan is great. The following analysis will show why.
My assumptions for this pamphlet are better than the Tax Foundations' which I believe show that Hillary’s annual GDP growth would be about 1.25% whereas Obama’s is currently about 1.5%. My assumptions for the Tax Foundations' give Trump an annual 2.3% growth. Note the Tax Foundation does not give an annually GDP growth rate but only a 10 year accumulated growth. If in fact I am overestimating, then my analysis is too good for both candidates. In addition I would add the following table to the Tax Foundations’ results above.
My Analysis
(FY 2017-2026 Ten Years)
| Items | Trump's Results | Hillary's Results |
| Debt (Above Obama Trend) (3% annual spending increase) |
+$3.9 T ($628 B Interest on Debt in 2026) (Increasing Forever) |
+$20.4 T ($1,004 B Interest on Debt in 2026) (Increasing Forever) |
From this I have calculated the Year the Debt will be paid off and how much the Interest Payments on the Debt will be in FY2026. Charts have been created.
Based on the Tax Foundation numbers, I have assumed for analysis a 1.4% GDP growth for Hillary and a 3.2% growth for Trump. Both are far below their own projected growth of 2% and 4% respectively and above the Tax Foundations' numbers. President Obama’s GDP growth indicates a non-recovery in the GDP that has materialized in only a 1.5% GDP growth during the recovery period since 2009. Hillary is projected to make this non-recovery even worst.
My projections of the future GDP (Gross Domestic Product), Tax Revenues, Government Spending and interest rates (Federal Funds Rates) are static assumptions, that is, I have assumed that for the next ten years calculations have been spread out evenly over the period. This is not a modeling program that would include many areas of the economy, the elasticity of revenue, spending, investment, etc… This analysis also assumes that Debt Interest payments will COMPETE within the budget for Discretionary and Mandatory spending.
These assumptions are only to illustrate how the Debt will grow, when the Debt will be paid off and what will be the annual Interest payments on the Debt. In all tables, I concentrate on the data for FY 2026, ten years down the road.
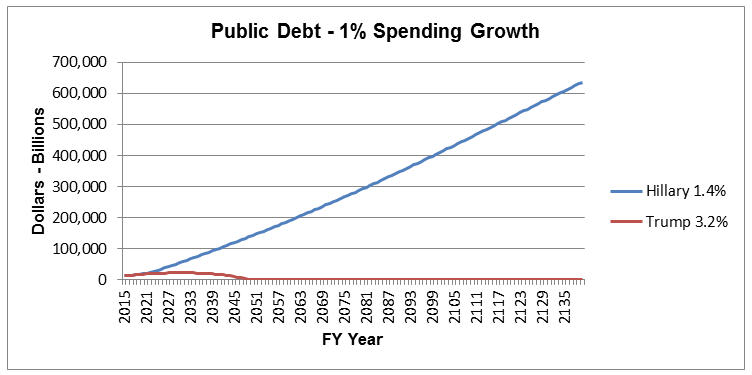
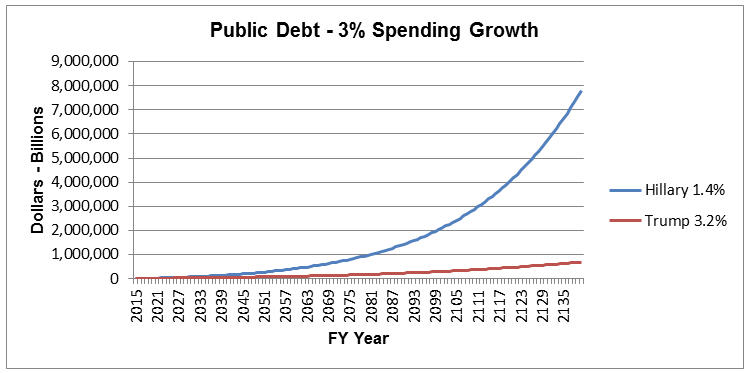
At 1.4% GDP growth, the debt will never be paid off if spending increases per the CBO projections of 3% to cover mandatory expenses.
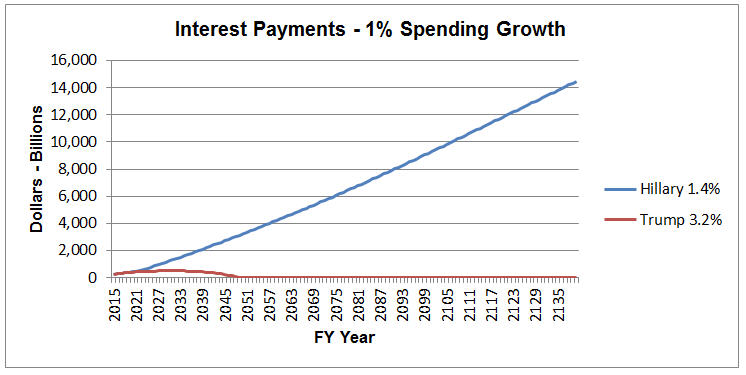
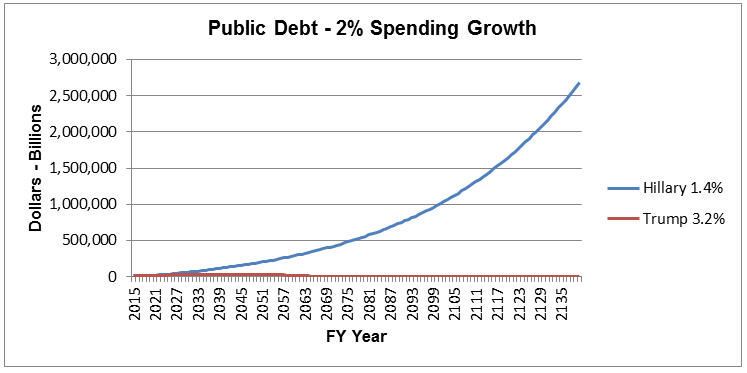
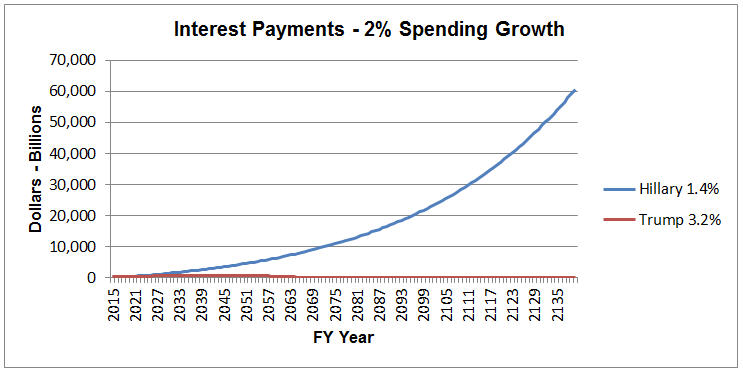
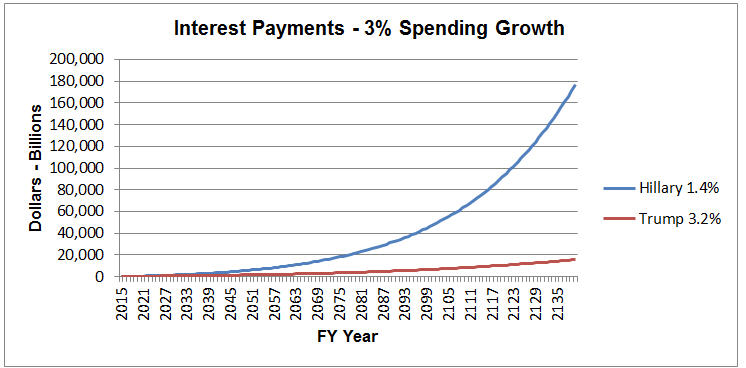
The Interest on the Public Debt in FY 2015 was $263 Billion. Under Hillary’s actual rate 1.4% GDP growth and at 1% spending growth, the interest on debt will be $860 billion in 2026 and increasing forever. At 2% spending growth, the interest on debt will be $926 Billion in 2026 and increasing forever. At 3% spending growth, the interest on debt will be $996 Billion in 2026 and increasing forever. This analysis includes additional taxes and increased spending.
Projections of debt reduction is shown below: (Shows Year debt is Zero)
Table 1 – Hillary’s Debt Reduction
(0% Federal Funds Rate Growth)
(Year the Debt is Zero)
| GDP Growth |
Interest Rate Growth |
|
||||
| 1.4 % | 0.0 % |
|
(Note: The above based on Revenues are 21.5% of GDP)
Table 2 – Hillary’s Debt Payments
(0% Federal Funds Rate Growth)
(FY 2026 Payment)
| GDP Growth |
Interest Rate Growth |
|
||||
| 1.4 % | 0.0 % |
|
(Note: The above based on Revenues are 18.05% of GDP)
As a comparison with Trump’s GDP growth of 3.2% it will still take many years for the next three generations to pay off the debt. At a 3.2% GDP growth and 1% spending growth, the interest on the debt will be $483 Billion in 2026 and zero in 2050. At 2% spending growth, the interest on debt will be $535 Billion in 2026 and zero in 2067. At 3% spending growth, the interest on debt will be $591 Billion in 2026 and zero in 2217. This analysis includes reduced taxes and increased spending.
Table 3 – Trump’s Debt Reduction
(0% Federal Funds Rate Growth)
(Year the Debt is Zero)
| GDP Growth |
Interest Rate Growth |
|
||||
| 3.2 % | 0.0 % |
|
(Note: The above based on Revenues are 14.88% of GDP)
Table 4 – Trump’s Debt Payments
(0% Federal Funds Rate Growth)
(FY 2026 Payment)
| GDP Growth |
Interest Rate Growth |
|
||||
| 3.2 % | 0.0 % |
|
(Note: The above based on Revenues are 18.0% of GDP)
The following charts illustrate the above data.
(0% Federal Funds Rate Growth)
(Hillary: 1.4% GDP Growth)
(Trump: 3.2% GDP Growth)
 |
 |
 |
 |
 |
 |
(Note: The CBO projection of spending is to be more than 3% per year.)
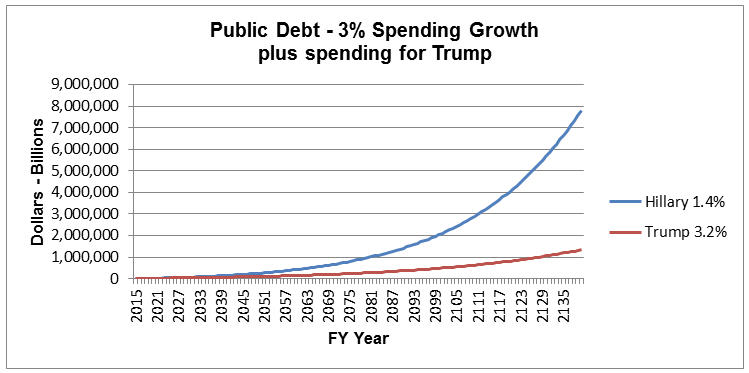
But to be fair, let's examine the possibility that Trump (Conservatives) have to increase spending for four (4) years in order to get the Military back to our national defense required posture ($300B), enforce the “Rule of Law” ($25B), to build the southern border wall ($25B), child care and maternity leave ($10B). Further assume that Trump has not had time to reduce spending in other areas of the government. So what would the data and the tables reflect on the debt reduction. The following data and tables assume that Hillary is continuing with her tax increases and increased spending.
The following charts illustrate the above data.
(0% Federal Funds Rate Growth)
(Hillary: 1.4% GDP Growth)
(Trump: 3.2% GDP Growth)
 |
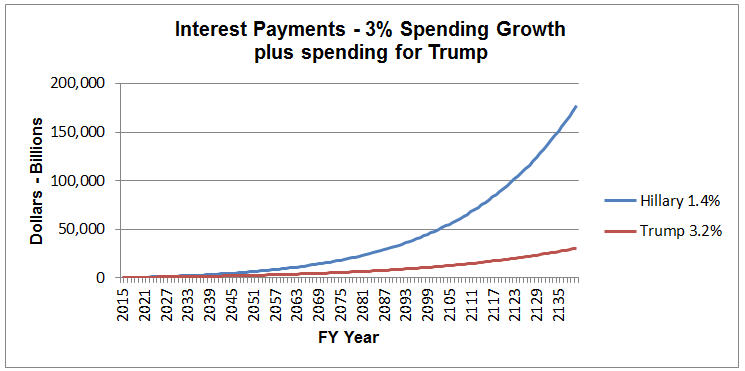 |
Remember that all of the above assume the Federal Funds Rate does not change over the extended periods of time. This is not true reality. Read the detail pamphlet #42 from our website to see what will happen when the Funds rate increases by 0.25% and 0.5% each year for the next ten years. The above scenarios are even worst.
| Questions |
|
For answers to these and other questions, read the other details pamphlets.
Learn what you can do to help save our Nation! Visit our Website Home Page!
Download Tax Foundation Update - pdf Version
| DONATE TODAY! |
|