A Pamphlet from Don Stuart, Preserve Our Nation, LLC
Pamphlet #42 - 09/12/2016
Pass this pamphlet to your friends!
Donate to Our Cause
Join Our Email List!
Pass this pamphlet to your children.
They need to know the truth about what our generation
is leaving them .
Give your adult children a chance to choose their own future.
Download This Pamphlet - pdf Version
Download Summary - pdf Version
Download Tax Foundation Update - pdf Version
Part 1: Debt Reduction Message
Our Only Goal: Children are Our Most Important Product.
Children are our only lasting product we will produce. All other products are only immediate needs. We are only here in this world for a fleeting moment; some say a “Flicker”. Our Children and their Children are our lasting vision for the future of the world.
| Point 1: |
The American Dream is to build a better future for our children. |
The American Dream is not about us, it is about our children and their future. I live and work for God, Family and Country. Our children are the reason our Nation exists.
What is crushing the American Dream and the future for our children?
The Debt
No one wants to talk about the Debt!
Debt is a very real issue for our children. The future economy is dependent on our children’s contribution. We don’t want to waste their money on paying off the Debt. While shouldering this Debt load, will our children and their children and their children be able to pursuit the American Dream?
Are you talking to your children about the Debt we are passing to them? What is happening to them is a disgrace and we should be ashamed for passing our current living expenses to them via the Debt. Not only is the Debt a burden on our children but the Debt distorts the economy by competing for private capital.
Our debt is off the scale and the most important goal is to get us on a path of paying off the $19 Trillion plus debt and fast growing debt. (Note: approximately $15 Trillion of the Debt is Public and the rest, $4.5 Trillion is Treasury Debt. Interest is paid only on Public Debt.)
“There is no more important question for the American prospect than accelerating the rate of economic growth” quoted by Larry Summers. The major benefit of a growing economy is raising the standard of living for the average American worker. Remember that growth compounds over time.
Michael A. Peterson, President and CEO of the Peter G. Peterson Foundation recently stated “Americans are
unified in their desire for candidates to put forward plans to address the national debt, and secure our nation’s
fiscal and economic future. Voters understand that putting the country on a sustainable long-term path today is
vital for a strong economy in the future.”
| Proposition 1 |
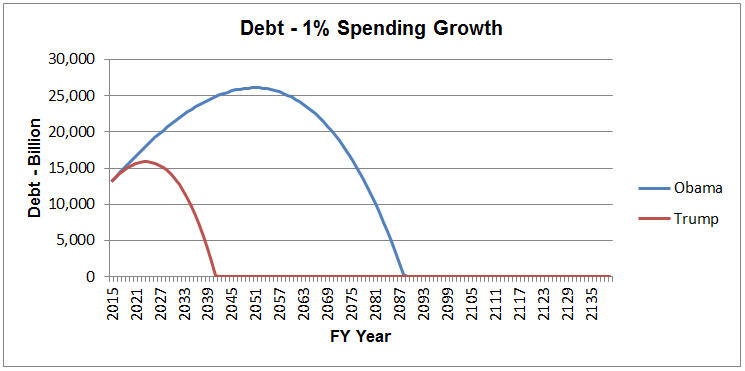
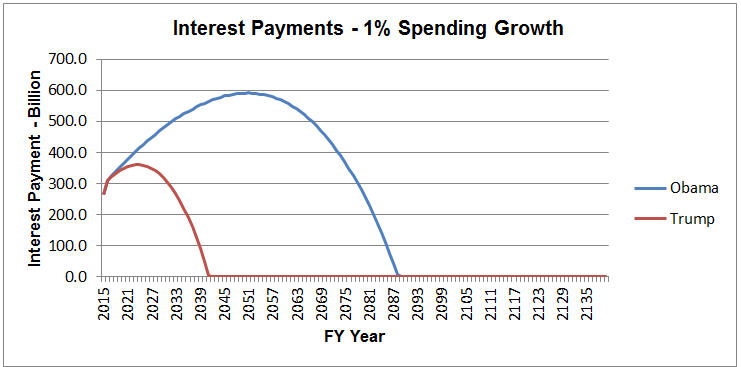
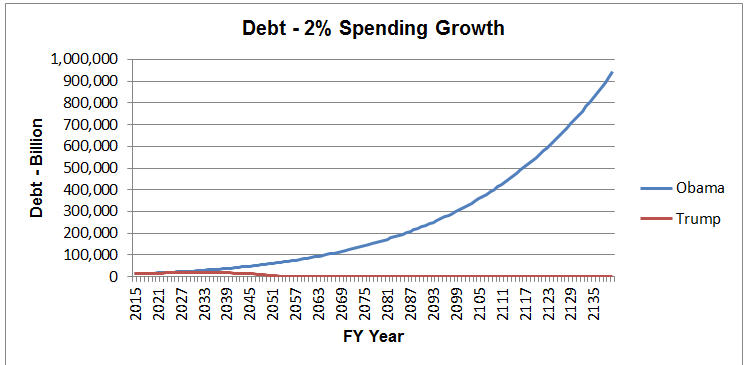
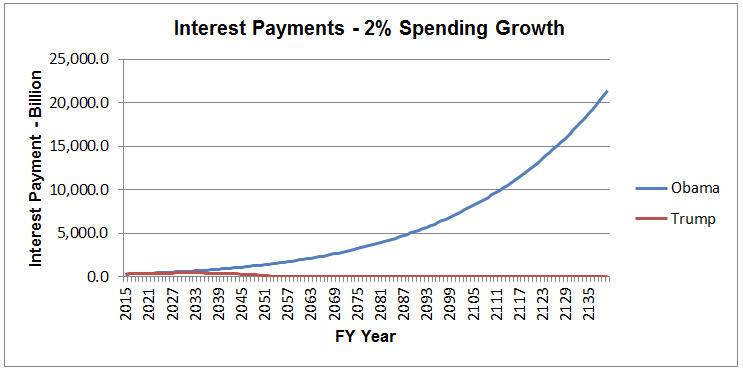
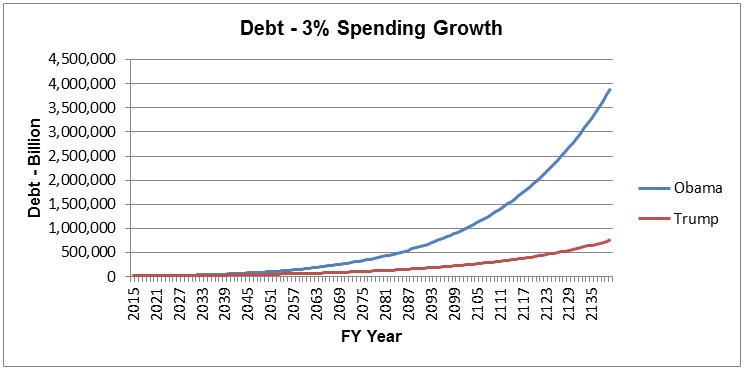
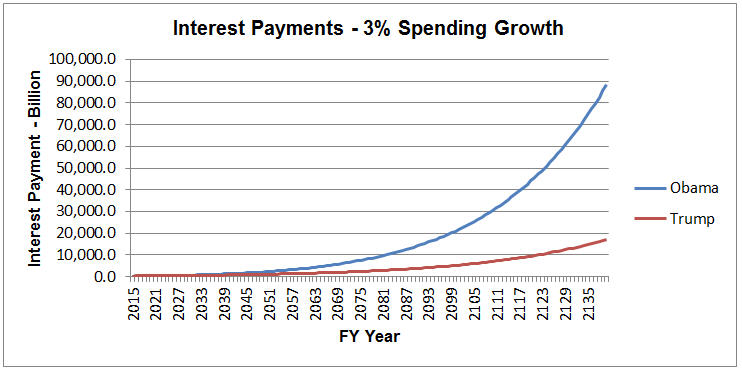
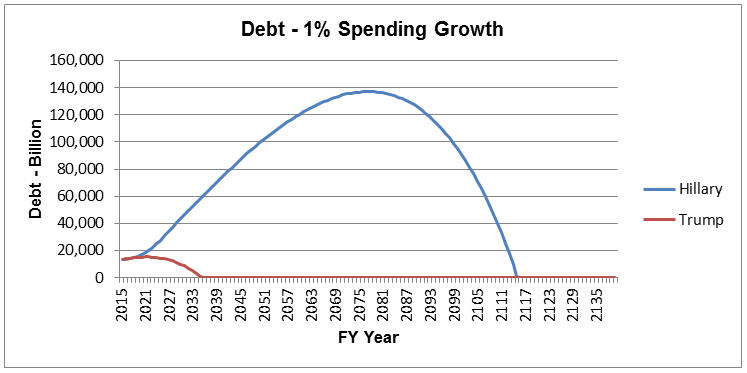
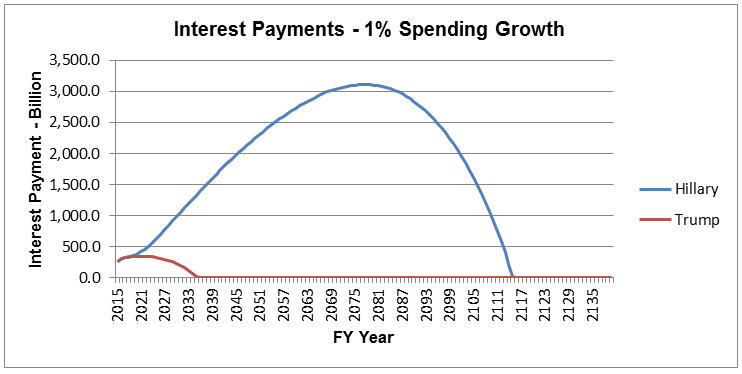
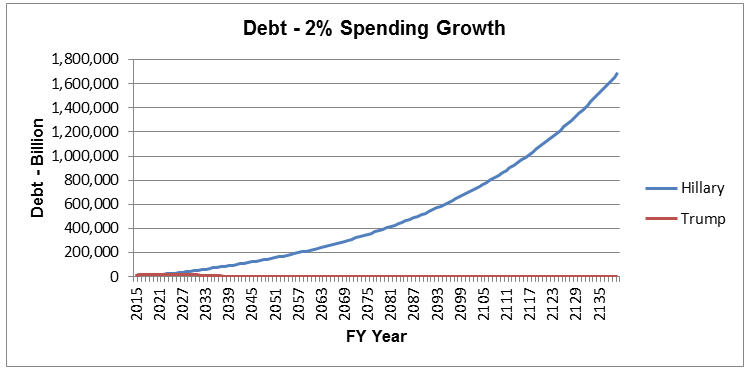
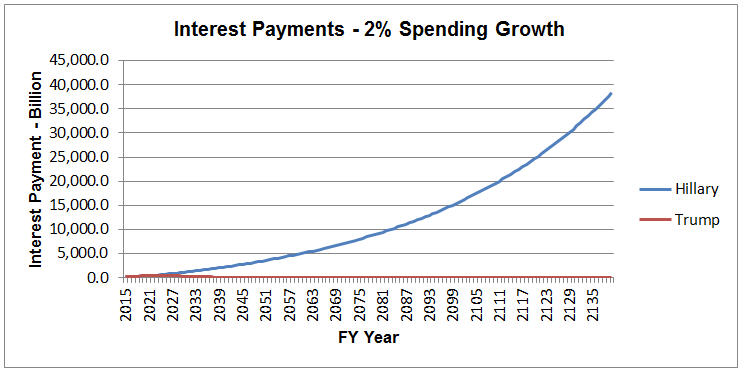
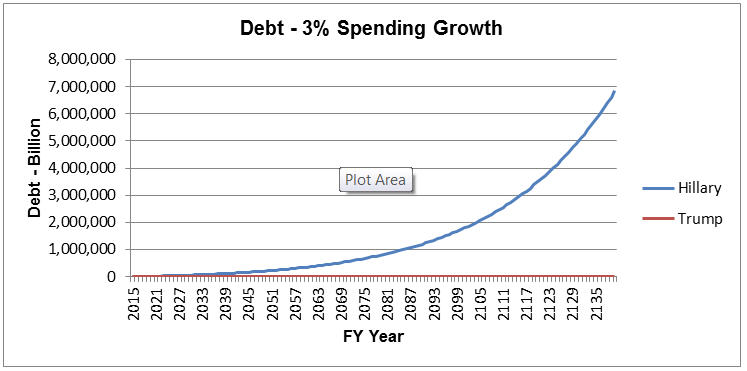
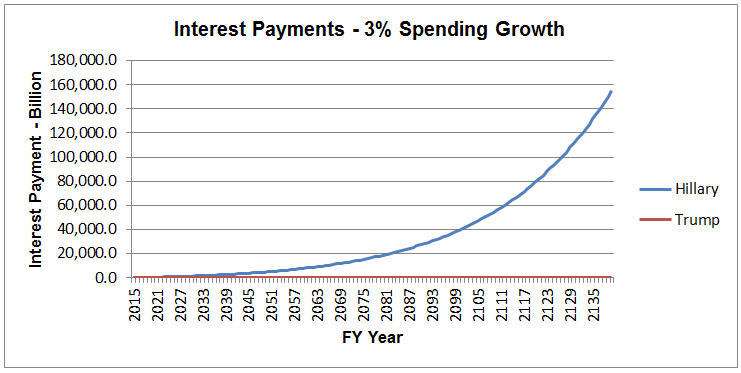
| This following proposition is to illustrate the Debt accumulation and the Interest Payments on the Debt by projecting the growth of GDP, Revenue and Spending: with Revenue at 18% of GDP; with Spending at 1%, 2% and 3% growth; and Funds Rate Growth of 0.0%. 1.5% current GDP growth versus 3.0% target GDP growth. (Obama-Liberal versus Trump-Conservative) |
| Note: All charts show a 120 year span showing Public Debt and Public Interest Payments. Also note scale changes. |
President Obama has stated that the 2% GDP growth is now the “NEW NORM”. President Obama’s and the Progressive Liberals' redistribution of wealth is more important than American growth and the average middle-class Americans’ wellbeing.
President Obama’s GDP growth indicates a non-recovery in the GDP that has materialized in only a 1.5%
GDP growth during the recovery period since 2009. Since the GDP is 70% consumer spending, the obvious
effect is that jobs filled during this period have not resulted in increased consumer spending
enough to push up the GDP. More part-time jobs are less productive and this facilitates our productivity to
fall which is a hindrance to rising GDP levels.
2017 - 2026 CBO Projections
|
The current CBO projection is that for the next ten years without any changes via Hillary or Trump, the economy will grow less than 2%, spending will increase more than 3% per year, mostly due to mandatory spending. Under this scenario, the 2026 Public Deficit will exceed $1 Trillion and the Debt will be 86% of GDP and the accumulated Public Debt will be $18 Trillion, up from $14 Trillion in FY 2015. Under this scenario, the FY 2026 interest on the public Debt will rise above $400 Billion (approximately 2% of GDP) with annually increases forever. The current low Federal Funds Rate hides the fact of the higher Debt Interest payments are looming in the future. |
| Point 2: |
But most important is the fact that under these conditions the Debt will never be paid off and the interest payments will continuously rise beyond sustainable limits. |
My projections of the future GDP (Gross Domestic Product), Tax Revenues, Government Spending and interest rates (Federal Funds Rates) are static assumptions, that is, I have assumed that for the next ten years calculations have been spread out evenly over the period. This is not a modeling program that would include many areas of the economy, the elasticity of revenue, spending, investment, etc…This analysis also assumes that Debt Interest payments will COMPETE within the budget for Discretionary and Mandatory spending.
These assumptions are only to illustrate how the Debt will grow, when the Debt will be paid off and what will be the annual Interest payments on the Debt. In all tables, I concentrate on the data for FY 2026, ten years down the road. The CBO projections above also use the same ten year period.
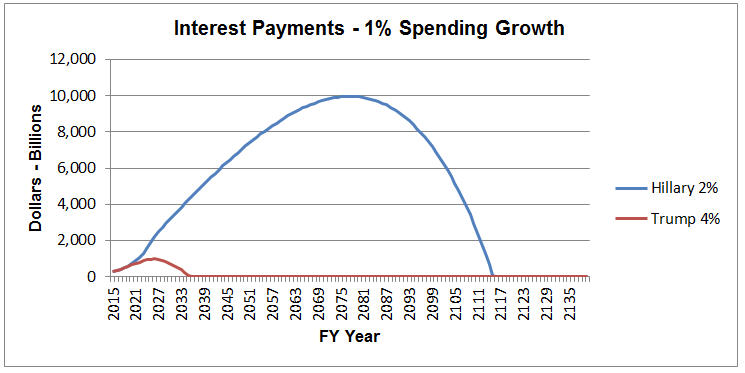
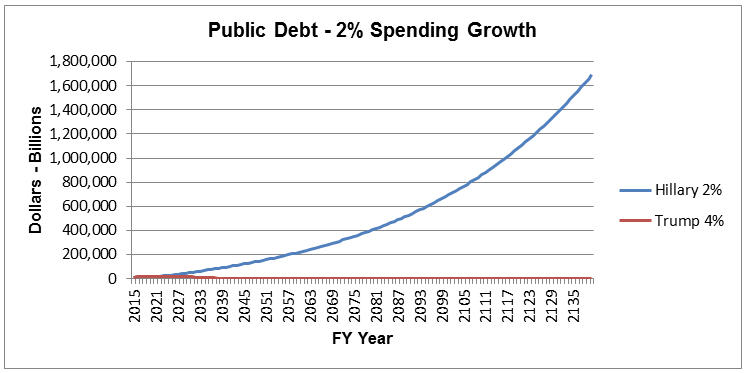
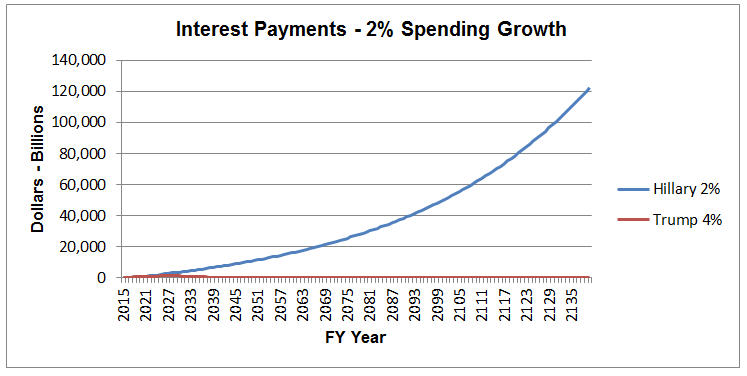
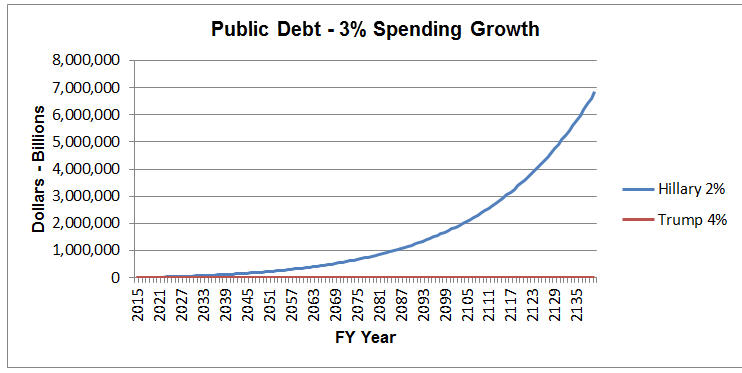
In the following, I am assuming a 2% growth for Hillary (let’s get her some benefits above the CBO projections above), 4% growth for Trump. We will look at how long it takes to reduce the Debt to zero and what the interest payments will look like for the next generations.
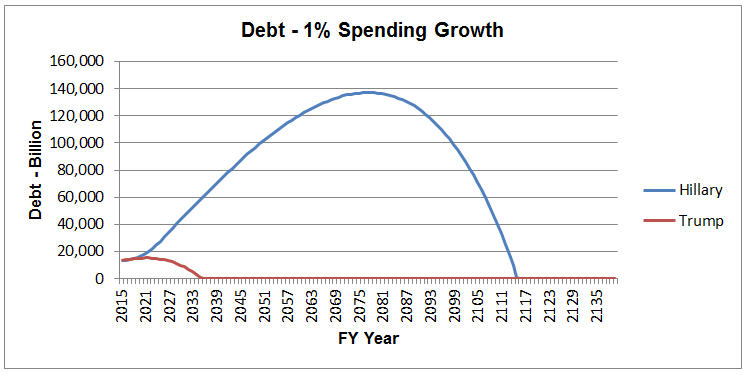
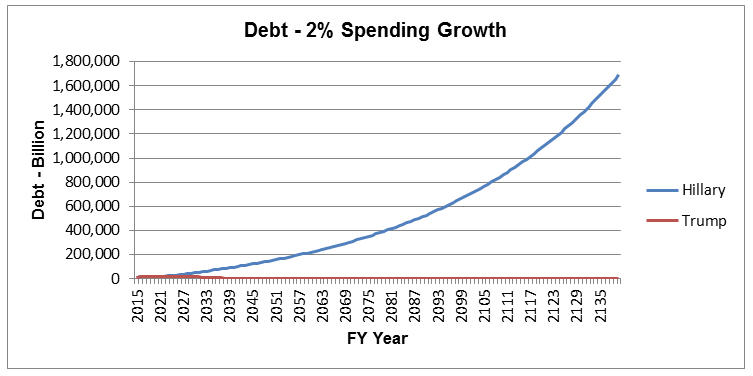
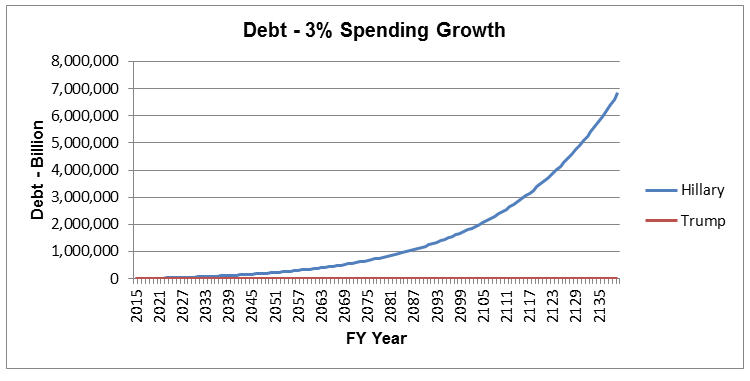
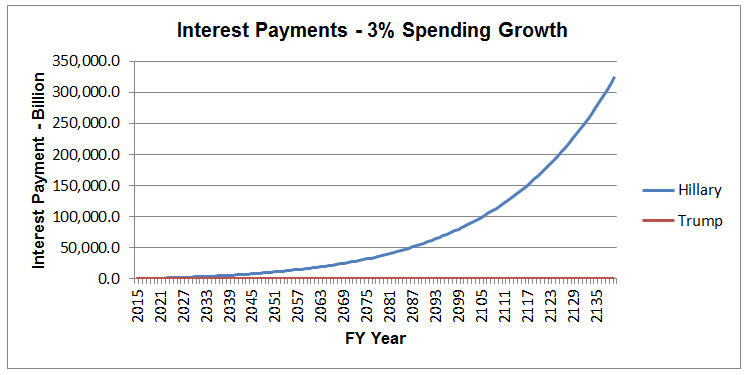
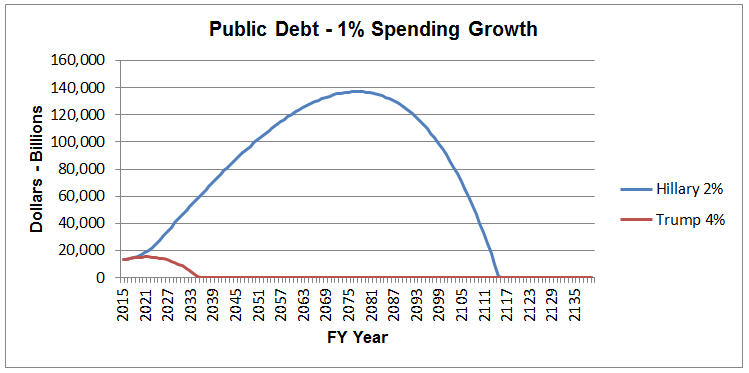
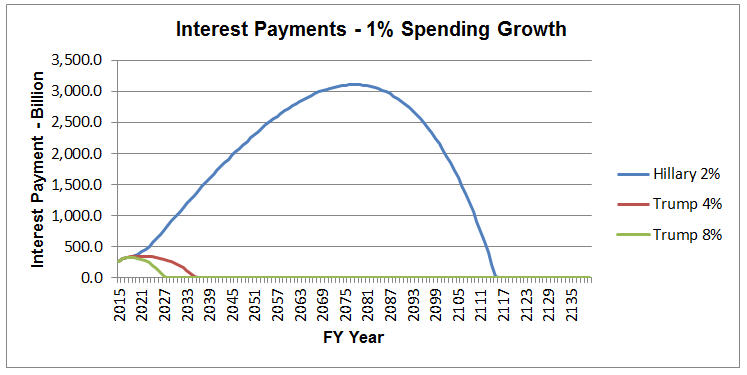
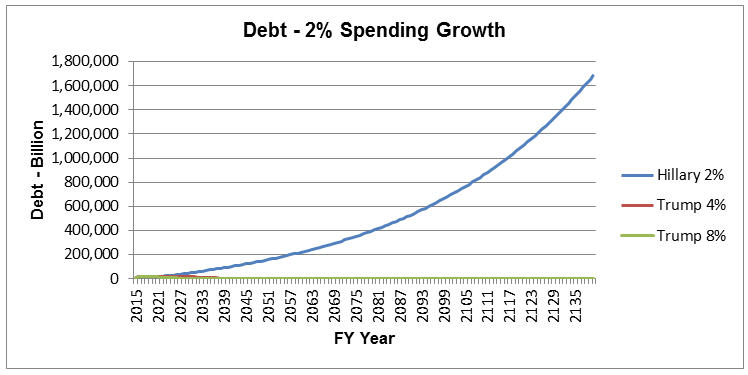
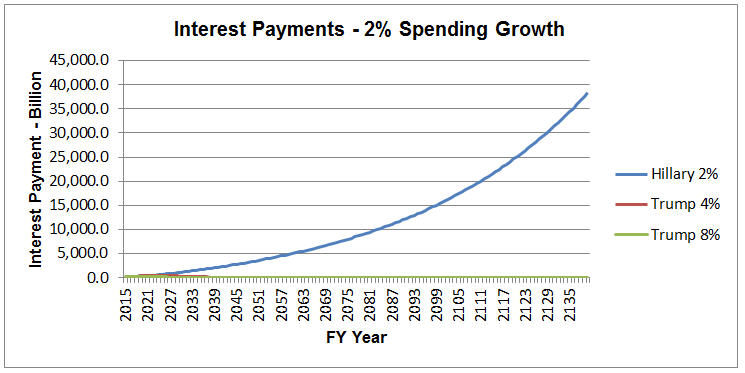
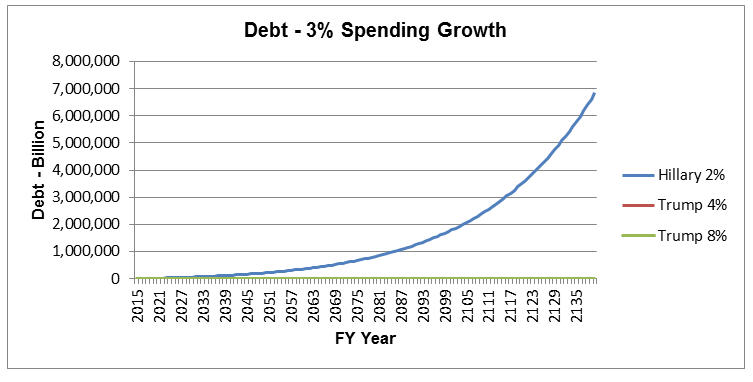
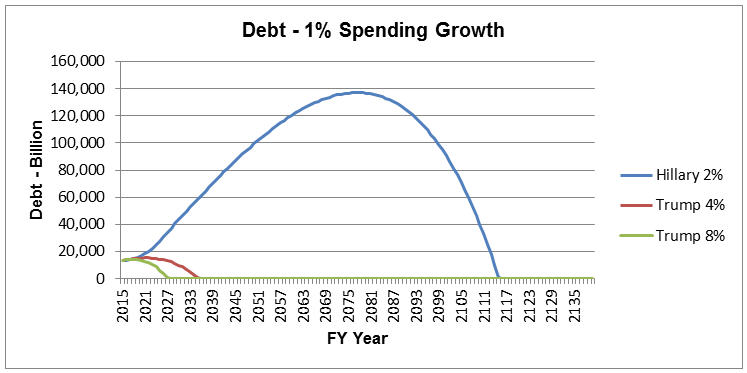
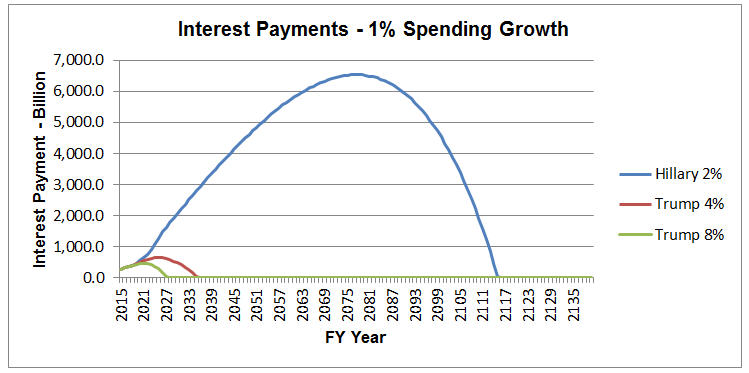
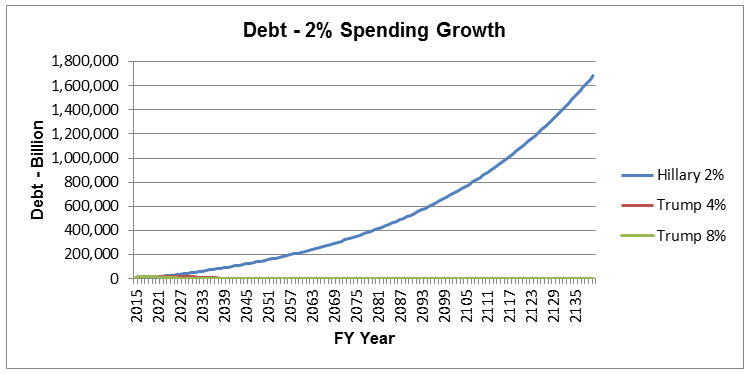
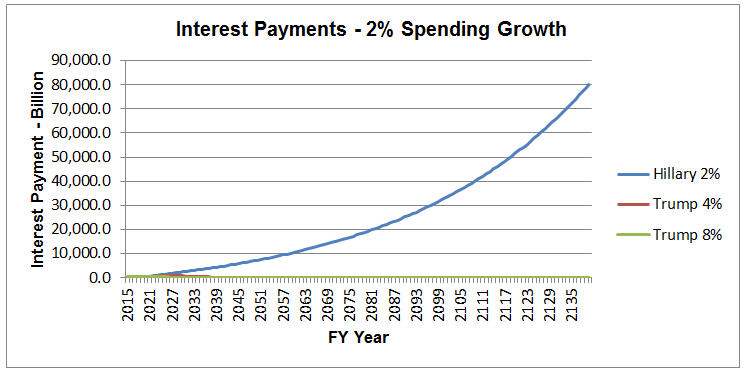
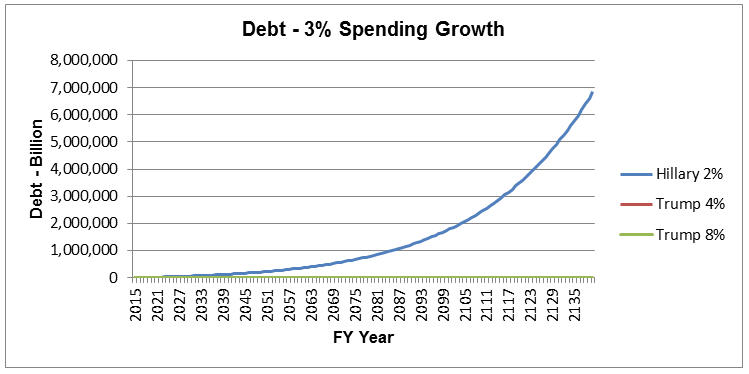
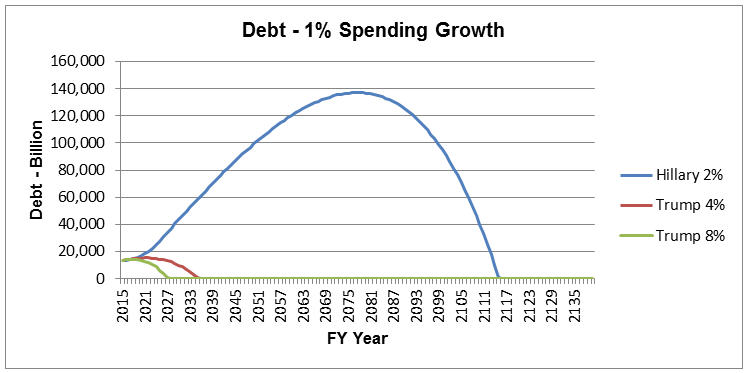
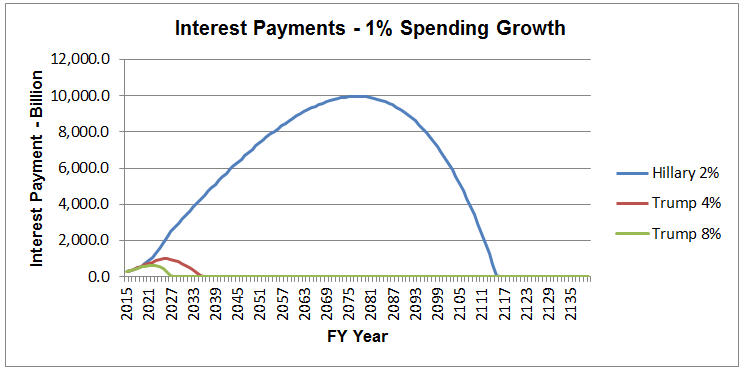
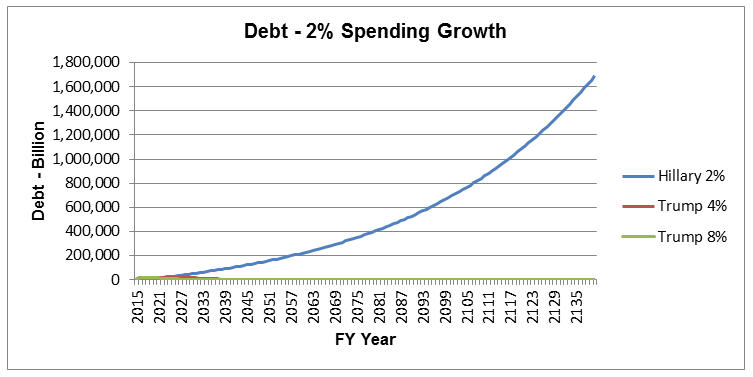
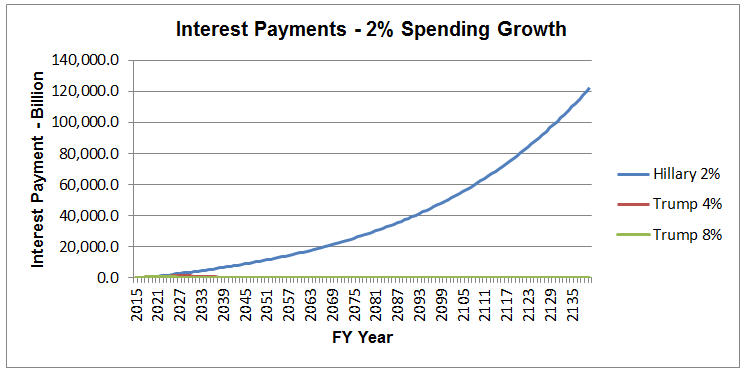
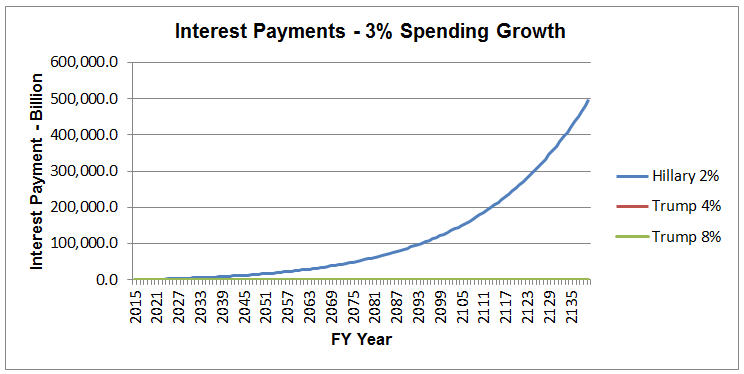
At 2% GDP growth, the debt will never be paid off if spending increases as little as 2% a year (The CBO estimates a 3% growth for the future). Even at a 1% growth rate on spending, the debt will only be paid off in 2088. Growth rate will never be restricted under Liberal Progressive policies.
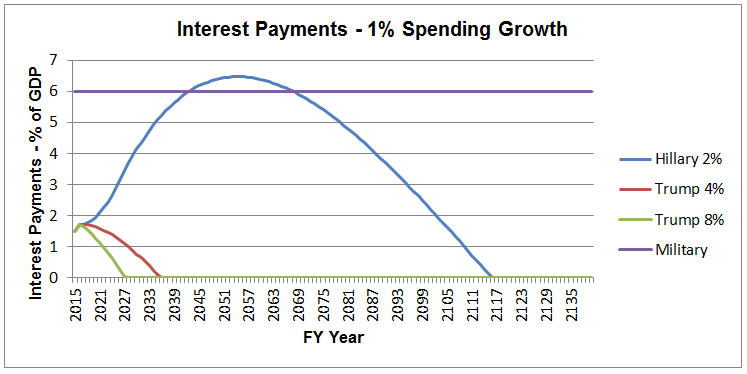
We are saddling our children and their children and their children with repaying the principle and paying the interest on the debt that we have accumulated. The interest payment on the Debt takes money away from businesses wanting to expand, hiring more workers and providing investment for research and new technologies. Higher interest payments on the Debt yields lower GDP growth. With increasing interest rates, the debt payments would easily exceed the amount we spend on the Military Spending in the Budget.
So there are some questions that should be answered.
| Questions |
|
As I continue to illustrate projections, I will use President Obama, Hillary Clinton and Donald Trump representing the current president and possible future president. I use Hillary Clinton and Donald Trump as illustrations of the Liberal Progressives and Conservative sides of the strategies, respectively.
Hillary continues to support government giveaways above the defense of the Nation. Under Hillary’s economic plan, we will be paying more on the interest on the Debt than on Defense.
By staying with President Obama’s plan, the CBO projects interest on the Debt at 6.1% of GDP will exceed defense authorization in FY 2045. By implementing Hillary’s plan, the interest on the Debt at 6.2% of GDP exceeds defense authorizations in FY 2032.
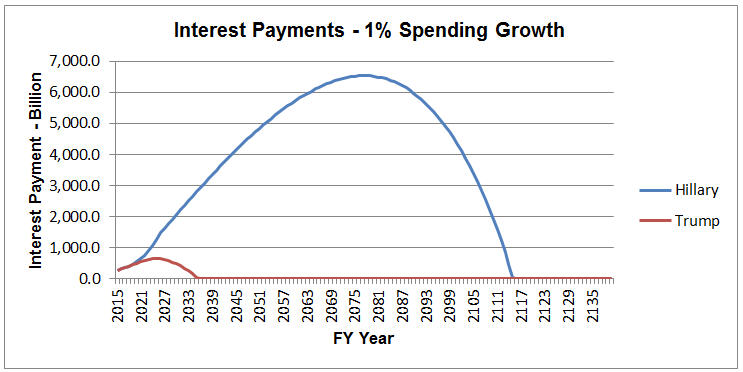
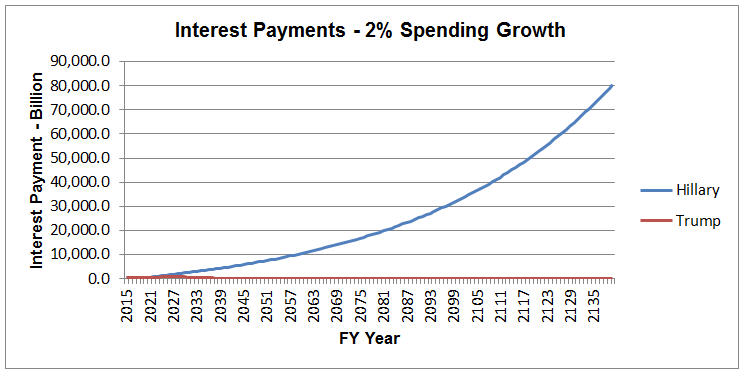
The Interest on the Public Debt in FY 2015 was $263 Billion. Under President Obama’s actual rate 1.5% GDP growth and at 1% spending growth, the interest on debt will be $433 billion in 2026 and zero in 2088. At 2% spending growth, the interest on debt will be $486 Billion in 2026 and increasing forever. At 3% spending growth, the interest on debt will be $542 Billion in 2026 and increasing forever.
Projections of debt reduction is shown below: (Shows Year debt is Zero)
Table 1 – President Obama's Debt Reduction
(Year the Debt is Zero)
| GDP Growth |
Interest Rate Growth |
|
||||
| 1.5 % | 0.0 % |
|
(Note: The above based on Revenues are 18% of GDP)
Table 2 – President Obama’s Debt Payments
(FY 2026 Payment)
| GDP Growth |
Interest Rate Growth |
|
||||
| 1.5 % | 0.0 % |
|
(Note: The above based on Revenues are 18% of GDP)
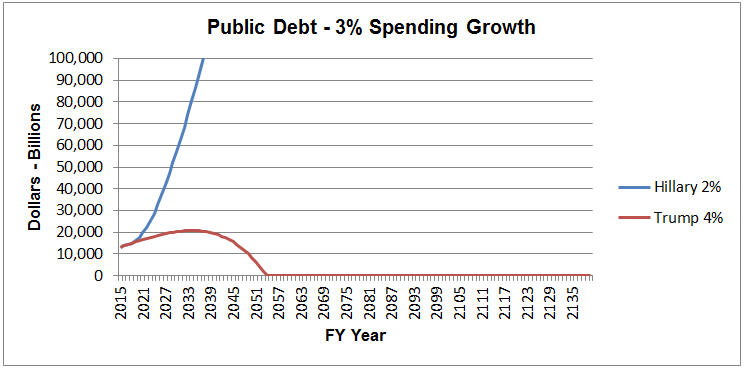
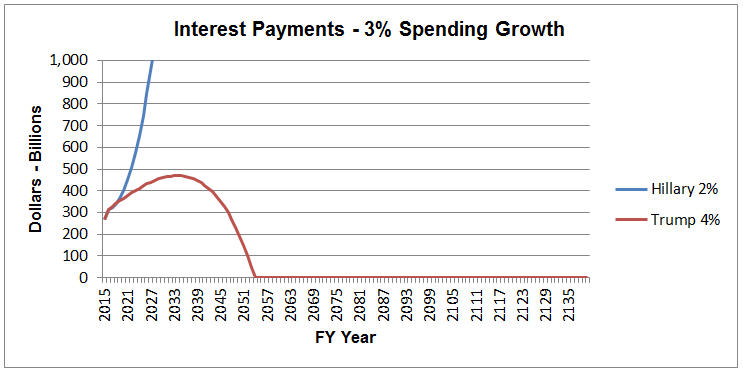
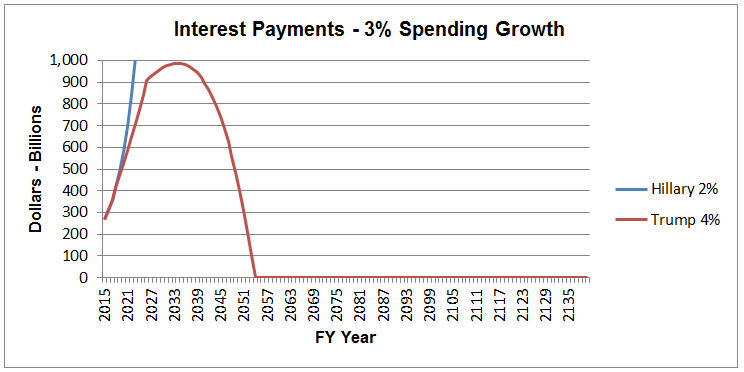
As a comparison with Economic growth of 3% it will still take many years for the next three generations to pay off the debt. At a 3% GDP growth and 1% spending growth, the interest on the debt will be $364 Billion in 2026 and zero in 26 years (2026). At 2% spending growth, the interest on debt will be $417 Billion in 2026 and zero in 40 years (2056). At 3% spending growth, the interest on debt will be $474 Billion and increasing forever.
Table 3 – Trump's Debt Reduction
(Year the Debt is Zero)
| GDP Growth |
Interest Rate Growth |
|
||||
| 3.0 % | 0.0 % |
|
(Note: The above based on Revenues are 18% of GDP)
Table 4 – Trump's Debt Payments
(FY 2026 Payment)
| GDP Growth |
Interest Rate Growth |
|
||||
| 3.0 % | 0.0 % |
|
(Note: The above based on Revenues are 18% of GDP)
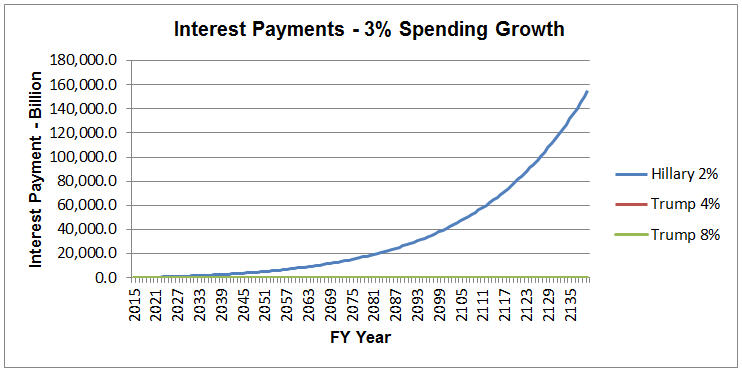
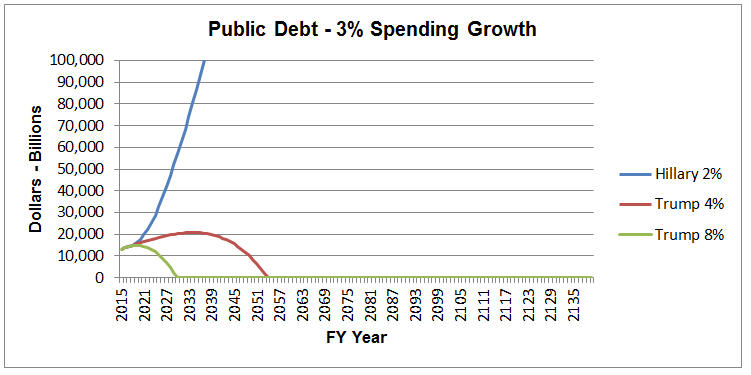
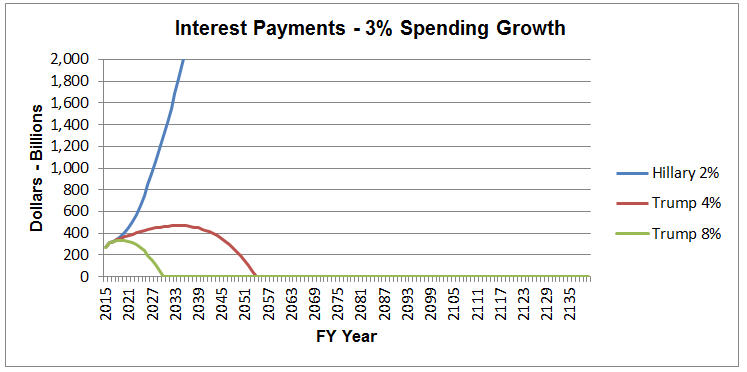
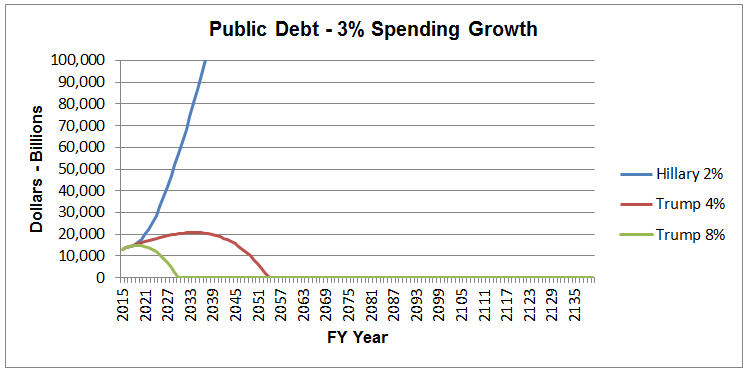
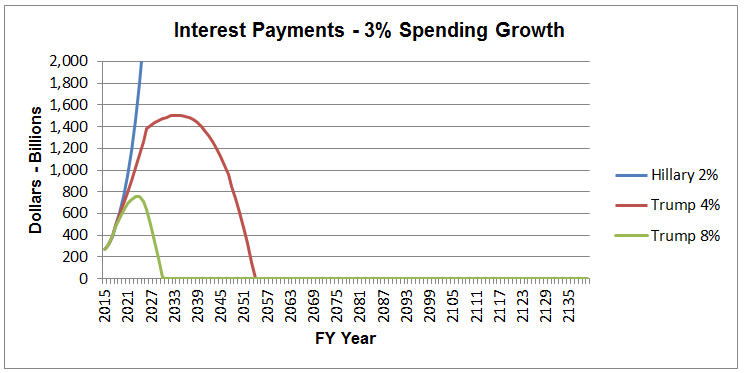
The following charts illustrate the above data.
(0% Federal Funds Rate Growth)
(Obama: 1.5% GDP Growth, Current and future Growth)
(Trump: 3.0% GDP Growth)
 |
 |
 |
 |
 |
 |
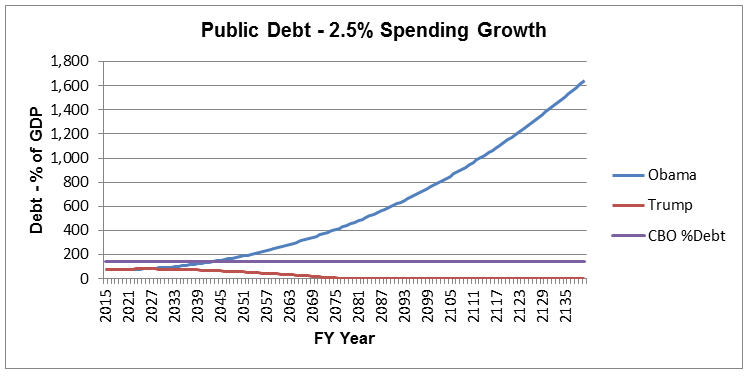
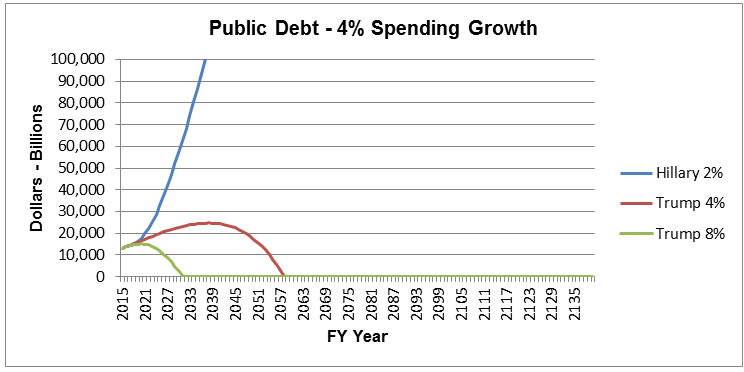
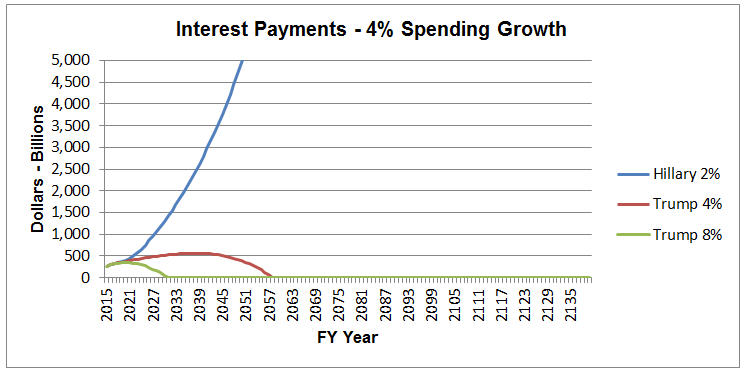
(Note: The CBO projection of spending is to be more than 3% per year.)
On our current fiscal path, the CBO projection is that our Debt will reach 141% of GDP over the next 30 years. We continue that projection for another 100 years. Our current path must change!
The following charts illustrate the CBO data.
(0.0% Federal Funds Rate Growth)
(Obama: 1.5% GDP Growth, Current and future Growth)
(Trump: 3.0% GDP Growth)
(CBO projection
of 141% when Interest > Military Spending)
 |
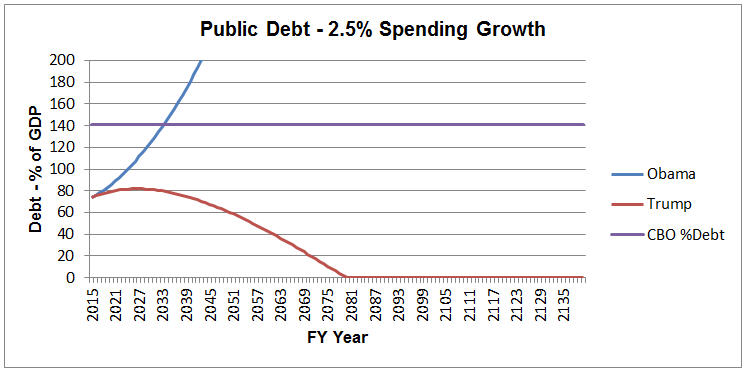
Let’s expand the above graph to see details.
(CBO projection of 141% when Interest > Military Spending)
 |
| Proposition 2 |
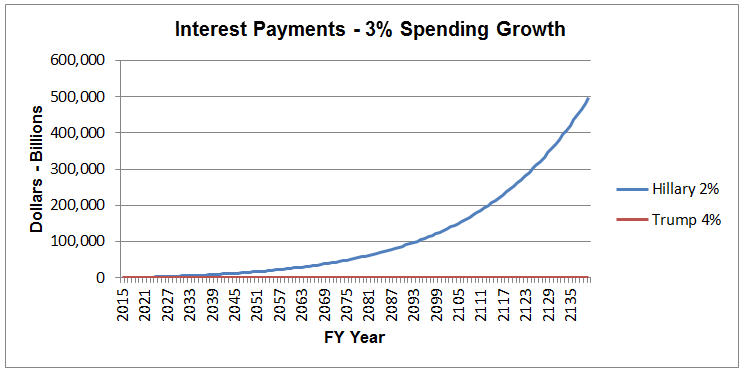
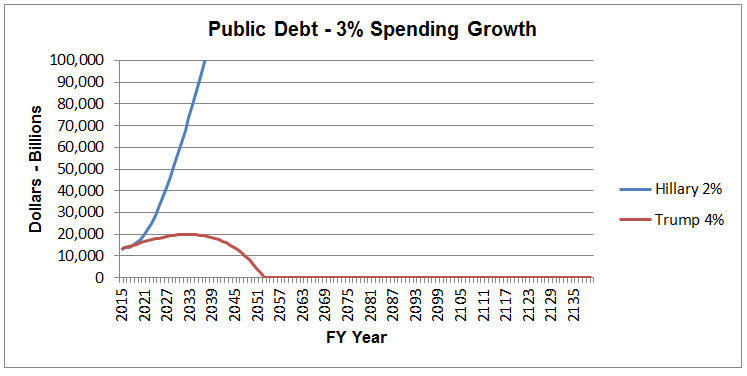
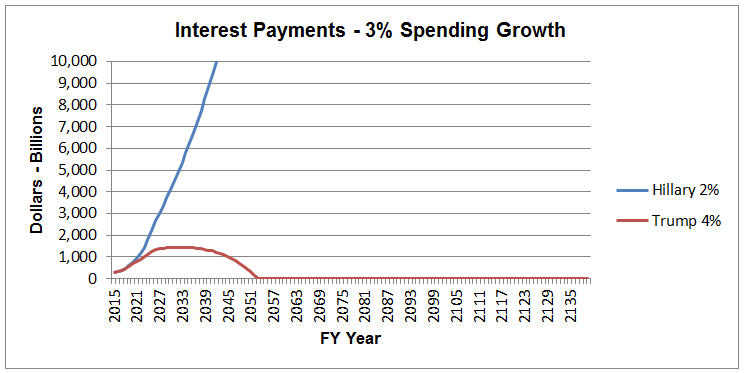
| This following proposition is to illustrate the Debt accumulation and the Interest Payments on the Debt by projecting the growth of GDP, Revenue and Spending: with Revenue at 21.5% (Hillary) and 18% (Trump) of GDP; with Spending at 1%, 2% and 3% growth; and Funds Rate Growth of 0.0%, 0.25% and 0.5%. 2.0% current GDP growth versus 4.0% target GDP growth. (Hillary-Liberal versus Trump-Conservative) |
| Note: All charts show a 120 year span showing Public Debt and Public Interest Payments. Also note scale changes. |
Let’s now pay attention to Hillary’s campaign proposals step by step.
|
Hillary is more progressive that President Obama and is expected to increase spending and raise taxes. Hillary will say she will increase tax revenues by taking money from the rich, but all that money is promised for her new redistribution programs. In fact, Hillary’s plans will add another $1 Trillion to the debt over the next 10 years. This leaves nothing for paying down the debt or annual deficit. Her only alternative is to raise tax rates. Hillary is pushing for Corporations, Wall Street Financial Centers and the Rich to pay their fair-share of taxes. And to pay down the debt in the future, Hillary is going to have to raise taxes on the Rich, maybe somewhere near 92% for those making over $2 Million. |
The following table is based on the “NEW NORM” of GDP growth of 2% and varying tax rates as a percentage of GDP. The following table also shows what Hillary’s projections for Debt reduction is without her spending increases.
Table 5 - Hillary's Revenue Tax Increases
(Does Not Include $350B annual
spending for 10 years with 2% GDP Growth)
(Year the Debt is Zero)
| Tax Revenue as % of GDP |
Interest Rate Growth |
|
||||
| 18 % | 0.0 % |
|
||||
| 20 % | 0.0 % |
|
||||
| 21.5 % | 0.0 % |
|
||||
| 22 % | 0.0 % |
|
||||
| 24 % | 0.0 % |
|
||||
| 26 % | 0.0 % |
|
||||
| 28 % | 0.0 % |
|
||||
| 30 % | 0.0 % |
|
(Note: * Debt is zero for several years but reappears and grows forever.)
As we all know, with these high projections of tax rates, the economy will collapse. With the high rates, the revenue will decrease and the GDP will decrease. This makes all the above projections fail for Hillary.
The next table includes Hillary’s new plan for $3.5 Trillion more spending in the next 10 years. That’s an additional $350 Billion per year. The following chart shows when the debt will be paid off under these assumptions.
Again this assumes that the interest rates on the debt do not grow. Remember that tax revenue of 18% of GDP is considered the historical percentage to sustain a vibrant economy: Not too high to hold the economy back but high enough to meet necessary spending (A balancing act).
This revenue percentage is shown to give the effects of rising tax rates as proposed by Hillary under the “NEW NORM” of 2% GDP growth. (Note: It’s hard to predict what percentage would represent the new taxes proposed by Hillary, but currently we are at 20.7% of GDP, so going to 21.5% is not unrealistic. In fact, this represents the $1.3 Trillion of revenue that Hillary wants to implement.)
The following table shows Hillary’s projections for Debt reduction based on her proposed spending increases. Note that the Debt payoff year is stretched from 2039 to 2116, another 77 years and is equivalent to three more generations of children.
Including the current generation, that makes four generations of children that will have to live under the threat of paying the Debt off.
Table 6 - Hillary's Specific Tax Increases
($350B annual spending for 10 years with 2% GDP Growth)
(Year the Debt is Zero)
| Tax Revenue as % of GDP |
Interest Rate Growth |
|
||||
| 18 % | 0.0 % |
|
||||
| 20 % | 0.0 % |
|
||||
| 21.5 % | 0.0 % |
|
||||
| 22 % | 0.0 % |
|
||||
| 24 % | 0.0 % |
|
||||
| 26 % | 0.0 % |
|
||||
| 28 % | 0.0 % |
|
||||
| 30 % | 0.0 % |
|
The above illustrations are based on the Federal Reserve keeping the Interests rates at current rates for the next 120 years. We know this is not going to happen. In December 2015, the Federal Reserve raised the rates by 0.25%. Assuming that over the next 10 years the interest rates increase 0.25% per year, the results of the above are blown out of the water! The charts below illustrate all the numbers.
The projections of debt payments in 2026 are shown below: (FY 2015 Debt Payment $263 Billion)
Table 7 – Hillary’s Debt Payments
(Includes $350B annual
spending for 10 years with 2% GDP Growth)
(FY 2026 Payment)
| GDP Growth |
Interest Rate Growth |
|
||||
| 2.0 % | 0.0 % |
|
||||
| 2.0 % | 0.25 % |
|
||||
| 2.0 % | 0.5 % |
|
(Note: The above based on Revenues are 21.5% of GDP)
Table 8 - Trump's Debt Payments
(FY 2026 Payment)
| GDP Growth |
Interest Rate Growth |
|
||||
| 4.0 % | 0.0 % |
|
||||
| 4.0 % | 0.25 % |
|
||||
| 4.0 % | 0.5 % |
|
(Note: The above based on Revenues are 18% of GDP)
The following charts illustrate the above data.
(0% Federal Funds Rate Growth)
(Hillary: 2.0% GDP Growth)
(Trump: 4.0% GDP Growth)
 |
 |
 |
 |
 |
 |
Above Chart Enlarged |
Above Chart Enlarged |
 |
 |
(Note: Review the scales on the above charts: $160 Trillion, $1,180 Trillion and $8,000 Trillion as shown on the Debt charts; $3.5 Trillion, $45 Trillion and $180 Trillion as shown on the Interest Payments charts.)
The following charts illustrate the above data.
(0.25% Federal Funds Rate Growth)
(Hillary: 2.0% GDP Growth)
(Trump: 4.0% GDP Growth)
 |
 |
 |
 |
 |
 |
Above Chart Enlarged |
Above Chart Enlarged |
 |
 |
(Note: Review the scales on the above Interest Payments charts: $7 Trillion, $90 Trillion and $350 Trillion. These are double the previous set of charts.)
The following charts illustrate the above data.
(0.5% Federal Funds Rate Growth)
(Hillary: 2.0% GDP Growth)
(Trump: 4.0% GDP Growth)
 |
 |
 |
 |
 |
 |
Above Chart Enlarged |
Above Chart Enlarged |
 |
 |
(Note: Review the scales on the above Interest Payments charts: $12 Trillion, $140 Trillion and $600 Trillion. These are double the previous set of charts.)
Remember that Debt is paying for past consumptions. What are the millennials willing to give up, in order, for paying the principle and interest on the debt: Economic Growth, expanding businesses, investment in research, more jobs, Social Security, Health Care, etc..? What are the millennials going to be forced to give up: Discretionary spending, Mandatory spending, or both? This is not something any of us want the future generations of our country to have to deal with.
So how do we get it paid off in less than 30 years? To do this we really need a 7-8% growth in the economy for the next 10 years. That will give the boost for high revenues in the future and if the government can keep spending to a minimum growth, then the debt can be paid off in 12 – 20 years.
Growth is the answer! Everything else will “live or die” based on the growth: Defense, Middle class progress, Dreams of moving up, Social programs surviving, the Environment.
Those in the political parties and radio hosts seem too satisfied with a meager 4% growth target rate in the future. Economic growth has to be greater for the next 10 years and close to 8% per year.
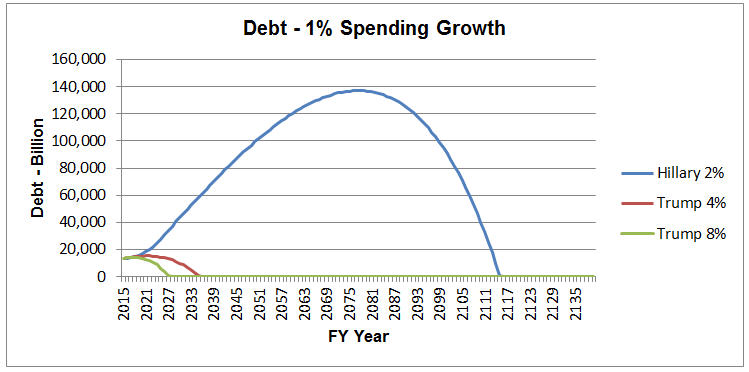
| Proposition 3 |
| This following proposition is to illustrate the Debt accumulation and the Interest Payments on the Debt by projecting the growth of GDP, Revenue and Spending: with Revenue at 21.5% (Hillary) and 18% (Trump) of GDP; with Spending at 1%, 2% and 3% growth; and Funds Rate Growth of 0.0%, 0.25% and 0.5%. 2.0% current GDP growth versus 8.0/4.0% target GDP growth. (Hillary-Liberal versus Trump-Conservative) |
| Note: All charts show a 120 year span showing Public Debt and Public Interest Payments. Also note scale changes. |
How to Grow the Economy?
The solution that I recommend will also allow other problems to be resolved. So let’s get to the solution to create 7-8% growth rate. With a 7-8% growth rate, the GDP will double in 10 years and can reduce the time to pay the debt down by at least 10 years.
This is the solution!
| Point 3: |
Implement the FairTax (Consumption Tax) and do away with the Income Tax and Corporate Tax. |
(Note: I do not favor the VAT tax but a Consumption tax collected by the States in conjunction with their State sales taxes.)
Economic growth is dependent on private investment, rising productivity, good education, good competing health-care system,
and a growing younger work-force from citizens or immigrants. With a declining U.S. birth rate, legal immigration to build
our younger work-force is necessary. The FairTax will release private investment (savings) and contribute to higher productivity,
both required for higher economic growth.
Private investment is hindered by the Income Tax System where savings is penalized with a higher percentage of the tax burden. A consumption tax treats everyone equally, but gives each individual the choice of spending or saving. A consumption tax does not put this negative burden on savings. Individuals who save are treated equally under a consumption tax. And remember that saving is investments.
Our income tax system is a Progressive system, since 1913, that forces higher earners to pay higher taxes via higher rates on higher incomes. A consumption tax treated everyone equally, but gives each individual the choice of spending or saving. A consumption tax has been estimated to add 5% to 9% of growth to the GDP. Let’s look at the results of our illustration of the FairTax generating an extra 4% GDP growth onto the targeted 4% GDP growth.
Results of doubling the GDP in 10 years (8% Growth):
| Results |
|
The adjusted projections of debt reduction to reflect 8% growth is shown below: (Shows Year debt is Zero)
Table 9 - Hillary's Debt Reduction
(Repeated from Table 6 above, Line 3)
(Year the Debt is Zero)
| GDP Growth |
Interest Rate Growth |
|
||||
| 2.0 % | 0.0 % |
|
(Note: The above based on Revenues are 21.5% of GDP)
Table 10 - Trump's Debt Reduction
(Year the Debt is Zero)
| GDP Growth |
Interest Rate Growth |
|
||||
| 4.0 % | 0.0 % |
|
||||
| 8.0 % for 10 years followed by 4.0% | 0.0 % |
|
(Note: The above based on Revenues are 18% of GDP)
Look at the savings in Interest Payments at 8% growth. $9.7 Trillion over the next 14 years could really expand our economy by eliminating annual deficits, increase spending on infrastructure, increased spending on education and many other needs. Instead this $9.7 Trillion is going to our debtors never to be available again.
Adjusting the above for the Interest rate growth of 0.25% and 0.5% for ten years, yield the following data. (Remember that the Military Budget as a percentage of GDP has historically been about 3% to 6%. FY 2015 Military Budget was $600B at 3.37% of GDP, the lowest in decades.)
|
|
|
The following two tables is a summary of the available choices for the future.
Table 11 illustrates Hillary’s future of increased taxes and increased spending for the Nation.
Table 12 illustrates Trump’s future of deceased taxes and decreased spending for the future.
Table 11 – Hillary’s Debt Payments
(Includes Annual Spending of $350B for 10 years)
(This includes the 21.5% Annual Revenue Tax Increases)
(FY 2026 Payment)
| GDP Growth |
Interest Rate Growth |
|
||||
| 2.0 % | 0.0 % |
|
||||
| 2.0 % | 0.25 % |
|
||||
| 2.0 % | 0.5 % |
|
(Note: The above based on Revenues are 21.5% of GDP. The highlighted areas indicate interest payment greater than Military spending of 6% of GDP. Remember that the current FY 2015 Military spending is 3.37% of GDP.)
Table 12 - Trump's Debt Payments
(FY 2026 Payment)
| GDP Growth |
Interest Rate Growth |
|
||||
| 4.0 % | 0.0 % |
|
||||
| 8.0 % for 10 years followed by 4.0% | 0.0 % |
|
||||
| 4.0 % | 0.25 % |
|
||||
| 8.0 % for 10 years followed by 4.0% | 0.25 % |
|
||||
| 4.0 % | 0.5 % |
|
||||
| 8.0 % for 10 years followed by 4.0% | 0.5 % |
|
(Note: The above based on Revenues are 18% of GDP)
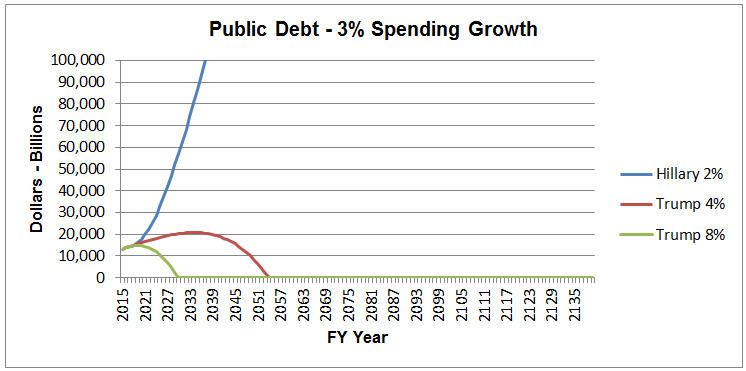
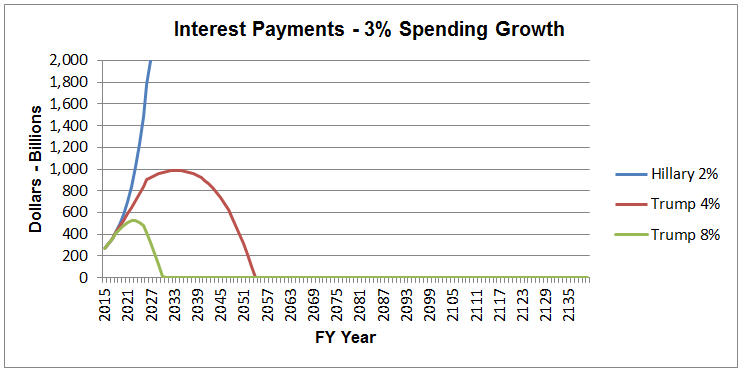
The following charts illustrate the above data.
(0.0% Federal Funds Rate Growth)
(Hillary: 2.0% GDP Growth)
(Trump: 4.0% GDP Growth)
(Trump: 8.0% GDP Growth for Ten years then 4.0% thereafter)
 |
 |
 |
 |
 |
 |
Above Chart Enlarged |
Above Chart Enlarged |
 |
 |
(Note: Review the scales on the above charts: $160 Trillion, $1,180 Trillion and $8,000 Trillion as shown on the Debt charts; $3.5 Trillion, $45 Trillion and $180 Trillion as shown on the Interest Payments charts.)
The following charts illustrate the above data.
(0.25% Federal Funds Rate Growth)
(Hillary: 2.0% GDP Growth)
(Trump: 4.0% GDP Growth)
(Trump: 8.0% GDP Growth for Ten years then 4.0% thereafter)
 |
 |
 |
 |
 |
 |
Above Chart Enlarged |
Above Chart Enlarged |
 |
 |
(Note: Review the scales on the above Interest Payments charts: $7 Trillion, $90 Trillion and $350 Trillion. These are nearly double the previous set of charts.)
The following charts illustrate the above data.
(0.5% Federal Funds Rate Growth)
(Hillary: 2.0% GDP Growth)
(Trump: 4.0% GDP Growth)
(Trump: 8.0% GDP Growth for Ten years then 4.0% thereafter)
 |
 |
 |
 |
 |
 |
Above Chart Enlarged |
Above Chart Enlarged |
 |
 |
(Note: Review the scales on the above Interest Payments charts: $12 Trillion, $140 Trillion and $600 Trillion. These are nearly double the previous set of charts.)
As you answer the following questions, remember the Military Budget ranges from 3% to 6% of GDP. In Table 11, Hillary’s Debt and Interest Payment, note the highlighted RED areas that show the percentage of GDP that is above the typical Military spending range. Millennial, you will be paying more for Debt service than for Defense. Also, review the CBO projections. Also note that the above two tables are based on different revenue projects: Hillary at 21.5% GDP and Trump at 18% GDP. Trump does not need the higher revenue rates to pay the Debt down to zero, the growing economy will generate the revenue.
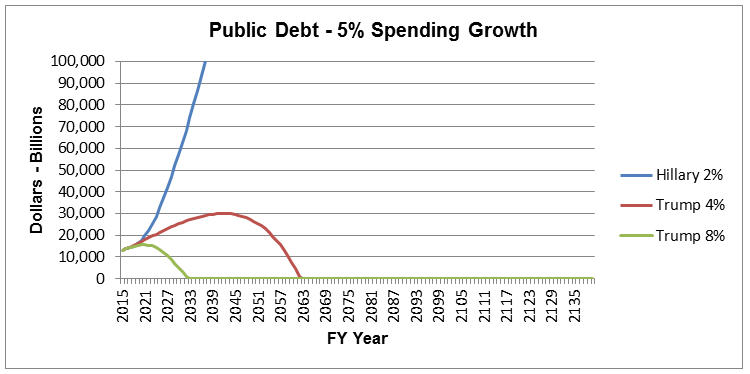
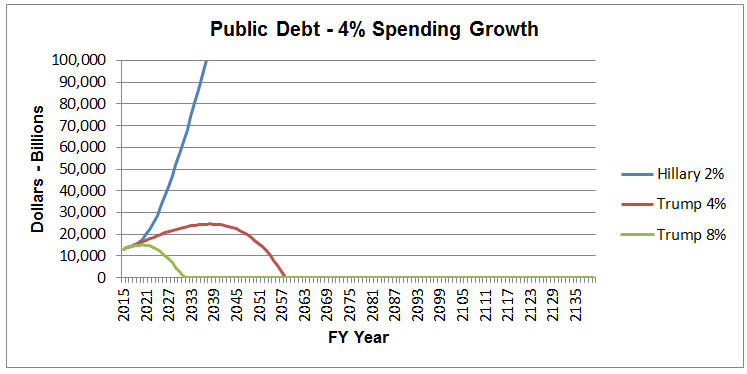
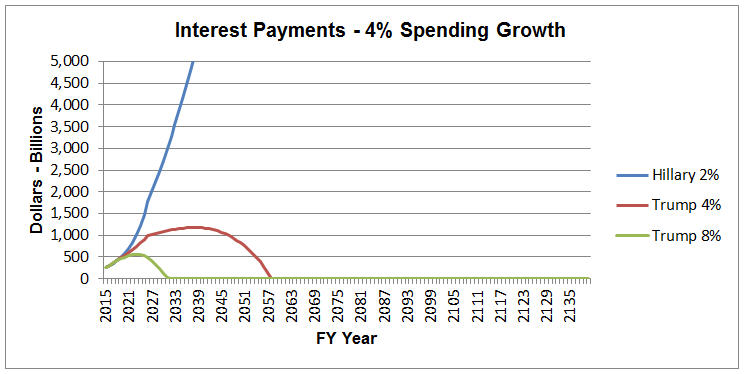
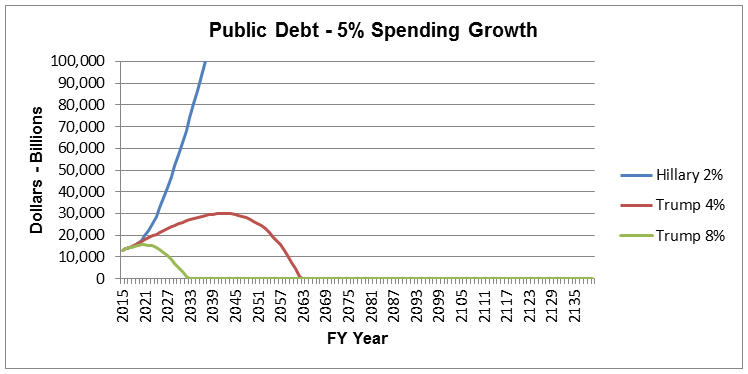
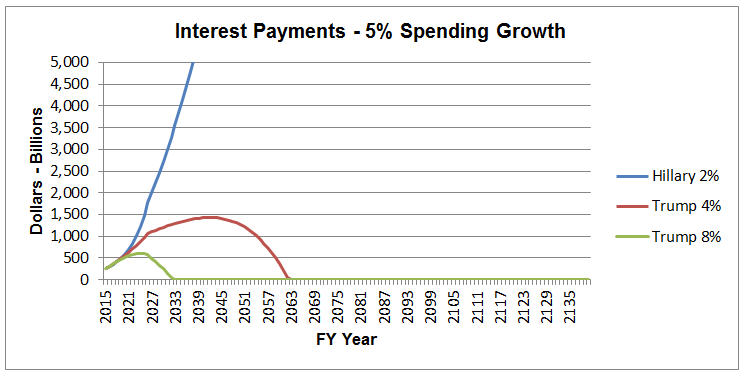
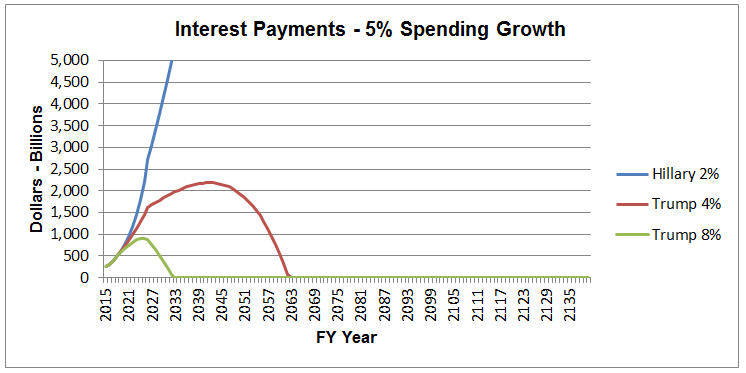
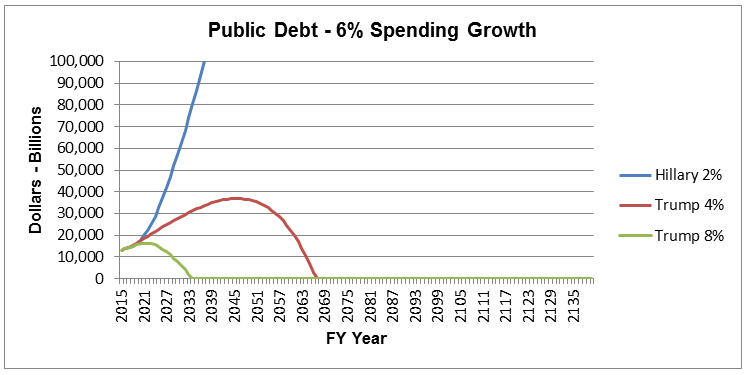
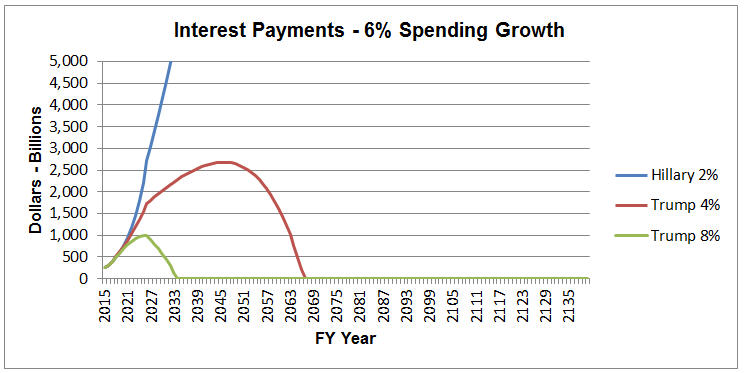
| Proposition 4 |
| This following proposition is to illustrate the Debt accumulation and the Interest Payments on the Debt by projecting the growth of GDP, Revenue and Spending: with Revenue at 21.5% (Hillary) and 18% (Trump) of GDP; with Spending at 3%, for Hillary; with Spending at 4%, 5% and 6% growth for Trump; and Funds Rate Growth of 0.0%, 0.25% and 0.5%. 2.0% current GDP growth versus 8.0/4.0% target GDP growth. (Hillary-Liberal versus Trump-Conservative) |
| Note: All charts show a 120 year span showing Public Debt and Public Interest Payments. Also note scale changes. |
But to be fair, let's examine the possibility that Trump (Conservatives) have to increase spending for four (4) years in order to get the Military back to our national defense required posture, enforce the "Rule of Law" , to build the southern border wall, child care and maternity leave. Further assume that he has not had time to reduce spending in other areas of the government. So what would the data and the tables reflect on the debt reduction. The following data and tables assume that Hillary is continuing with her tax increases and increased spending as shown in Table 11.
Table 13 - Trump's Increased Spending Debt Payments
(FY 2026 Payment)
| GDP Growth |
Interest Rate Growth |
|
||||
| 4.0 % | 0.0 % |
|
||||
| 8.0 % for 10 years followed by 4.0% | 0.0 % |
|
||||
| 4.0 % | 0.25 % |
|
||||
| 8.0 % for 10 years followed by 4.0% | 0.25 % |
|
||||
| 4.0 % | 0.5 % |
|
||||
| 8.0 % for 10 years followed by 4.0% | 0.5 % |
|
(Note: The above based on Revenues are 18% of GDP)
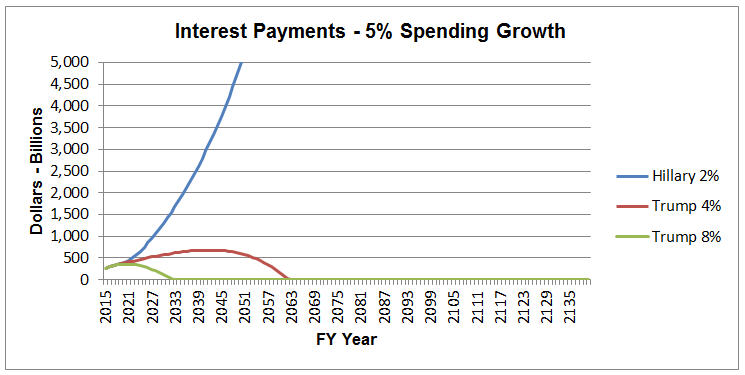
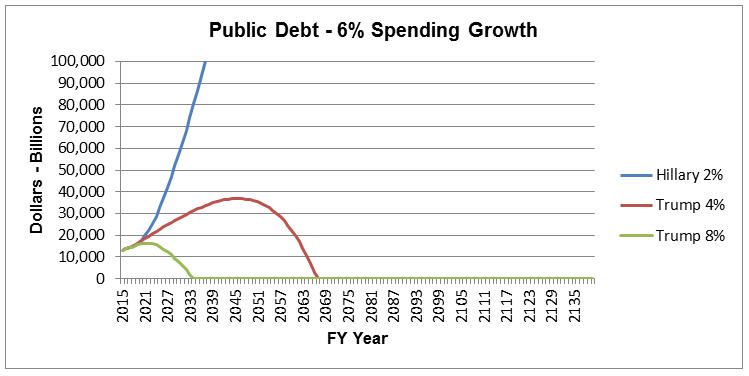
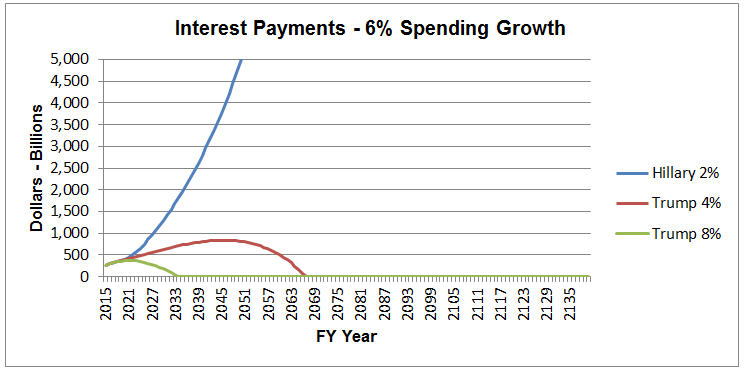
Conclusion: Even with Trump allowing more spending during the next four (4) years, even with 4%, 5% or 6% spending increases, the Debt reduction schedule is still better than Hillary's Liberal Progressive plans. The following charts make the point.
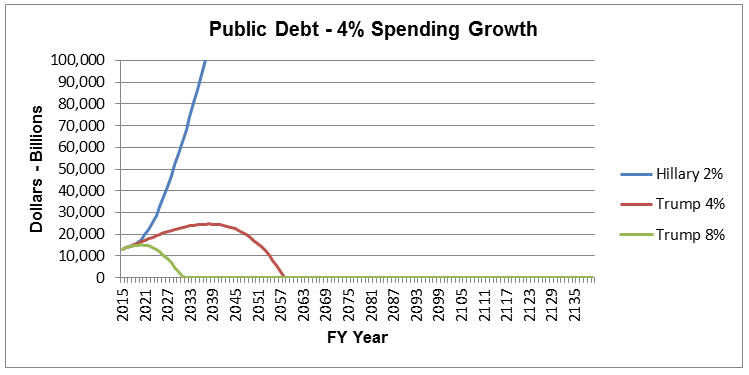
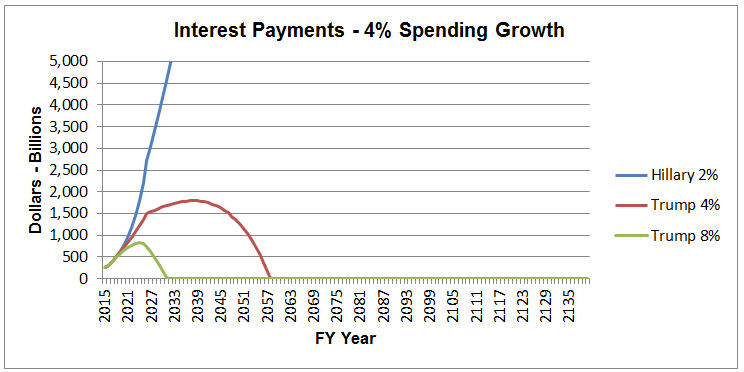
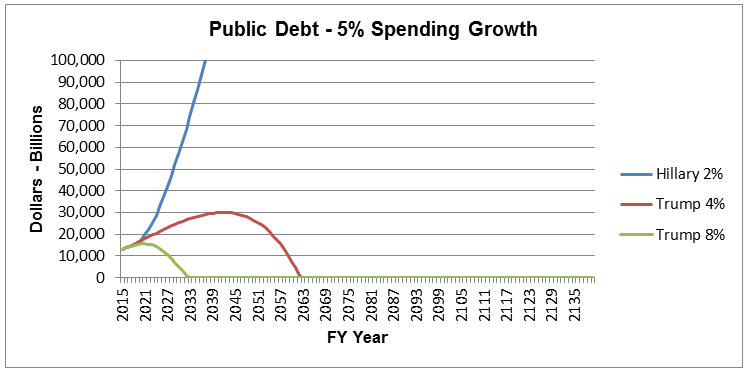
The following charts illustrate the above data.
(0.0% Federal Funds Rate Growth)
(Hillary: 2.0% GDP Growth)
(Trump: 4.0% GDP Growth)
(Trump: 8.0% GDP Growth for Ten years then 4.0% thereafter)
(This chart assumes that Trump Spending Increases for the next four (4) years)
 |
 |
 |
 |
 |
 |
The following charts illustrate the above data.
(0.25% Federal Funds Rate Growth)
(Hillary: 2.0% GDP Growth)
(Trump: 4.0% GDP Growth)
(Trump: 8.0% GDP Growth for Ten years then 4.0% thereafter)
(This chart assumes that Trump Spending Increases for the next four (4) years)
 |
 |
 |
 |
 |
 |
The following charts illustrate the above data.
(0.5% Federal Funds Rate Growth)
(Hillary: 2.0% GDP Growth)
(Trump: 4.0% GDP Growth)
(Trump: 8.0% GDP Growth for Ten years then 4.0% thereafter)
(This chart assumes that Trump Spending Increases for the next four (4) years)
 |
 |
 |
 |
 |
 |
| Proposition 5 |
| Consider the following questions! |
| Note: All charts show a 120 year span showing Public Interest Payments. Also note scale changes. |
So the question is for Millennial (Generation Y – less than 36 year old) and the new following Generation Z (less than 22 years old):
“Which program is best for your future: Income Tax or FairTax?”
“Which is best for your children and grandchildren: Income Tax or FairTax?”
“Do you really want to pass this debt along to them?”
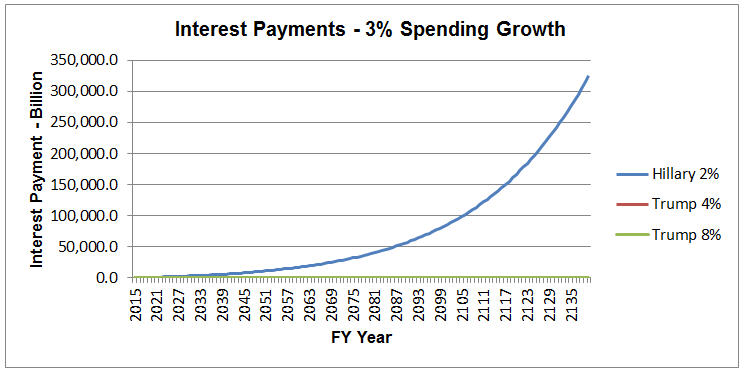
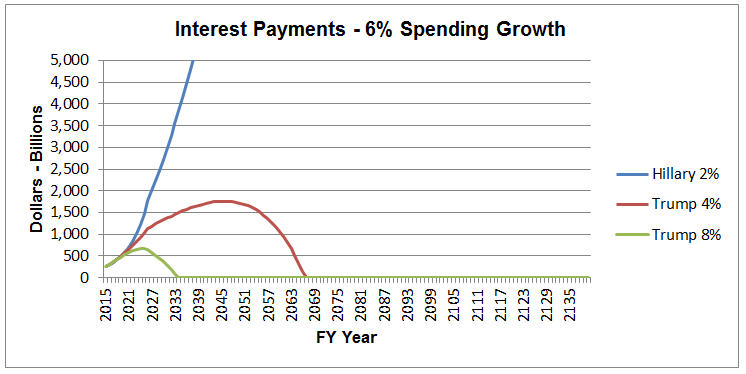
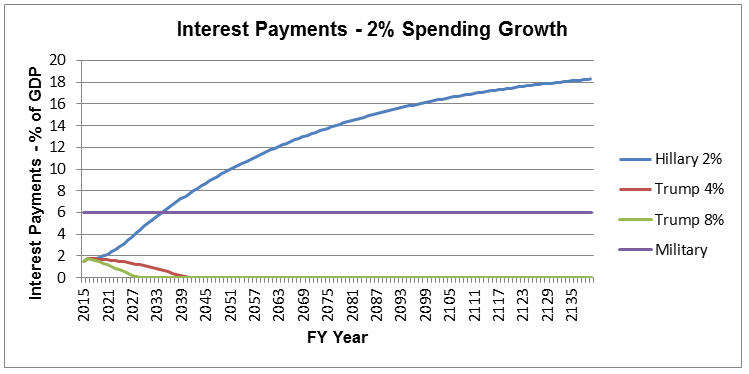
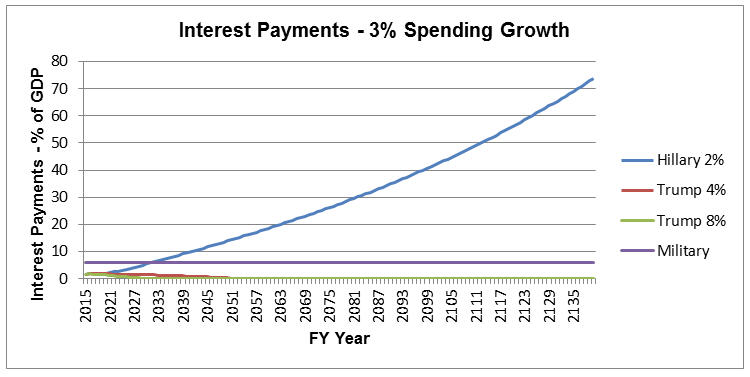
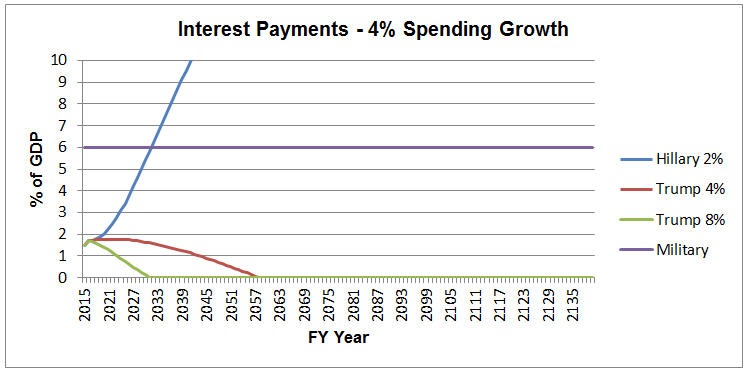
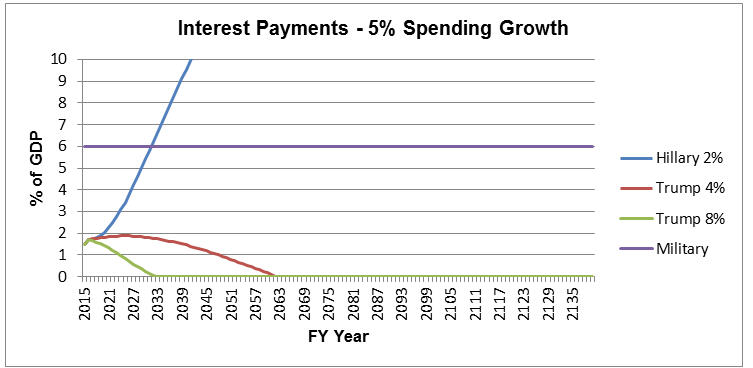
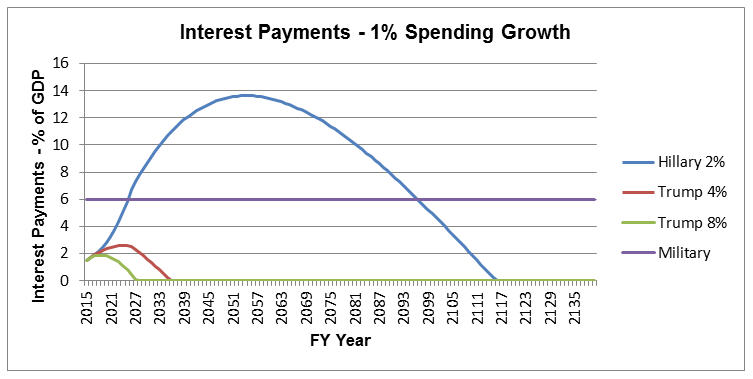
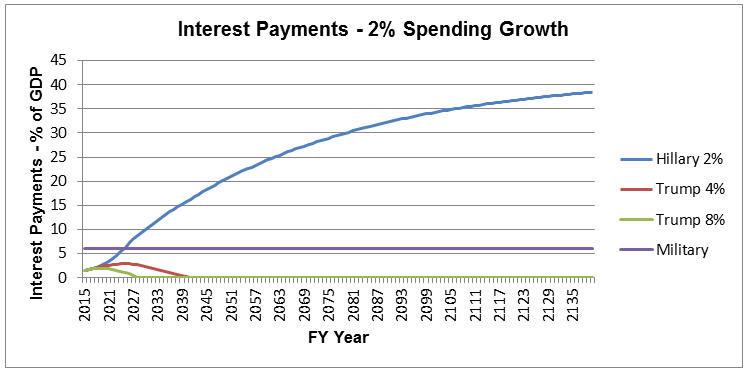
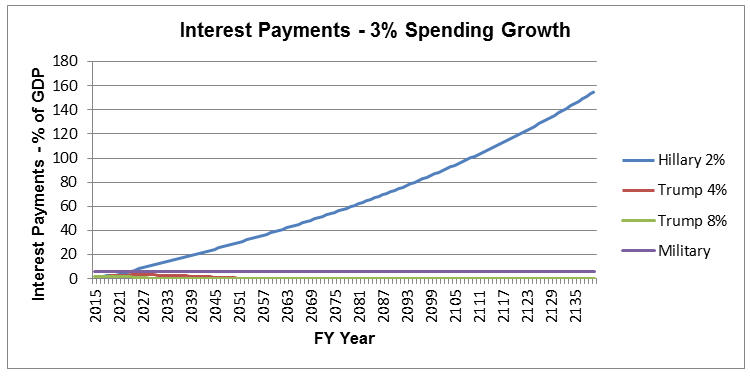
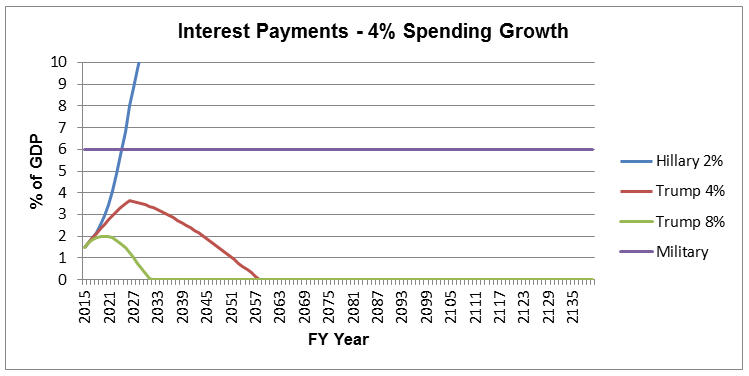
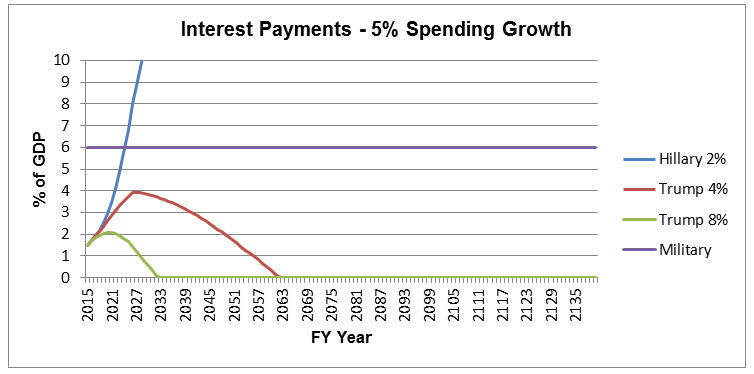
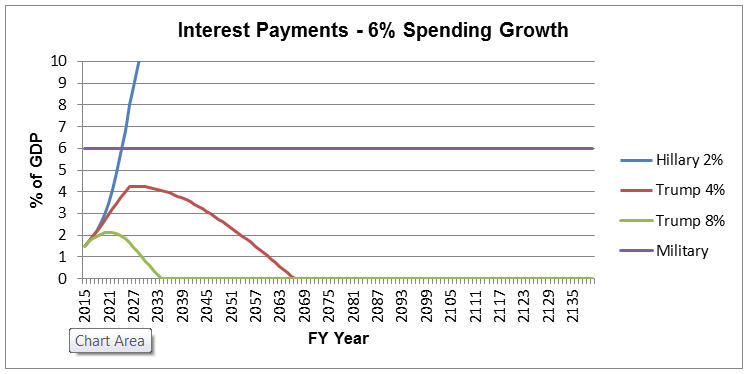
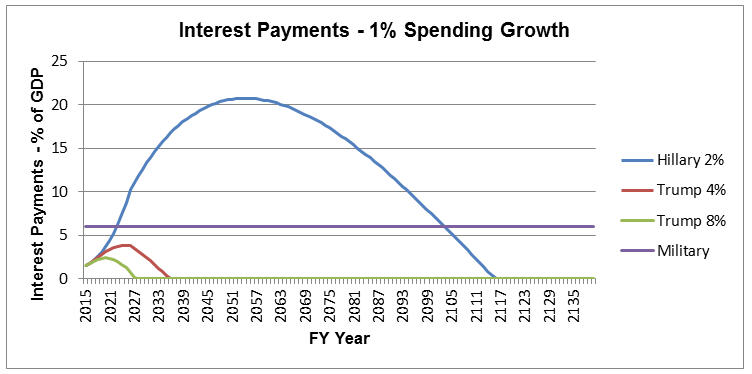
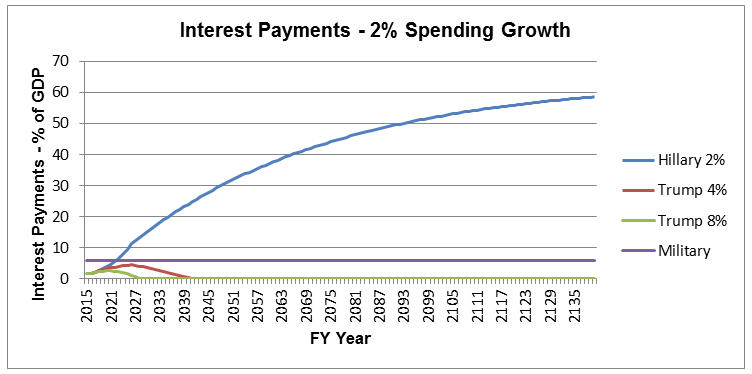
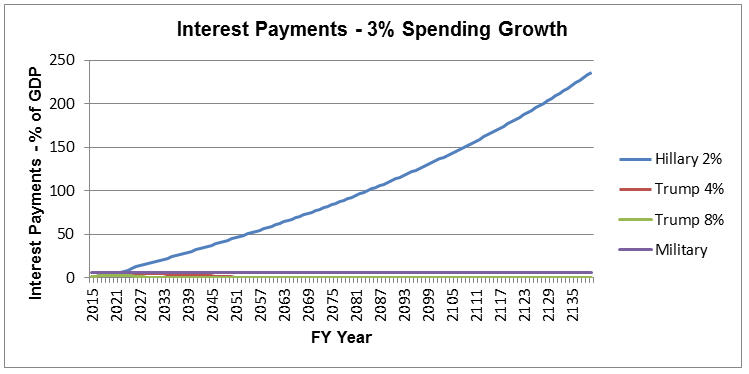
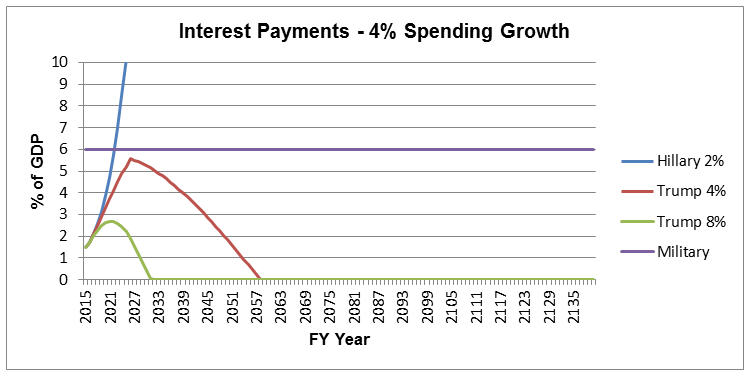
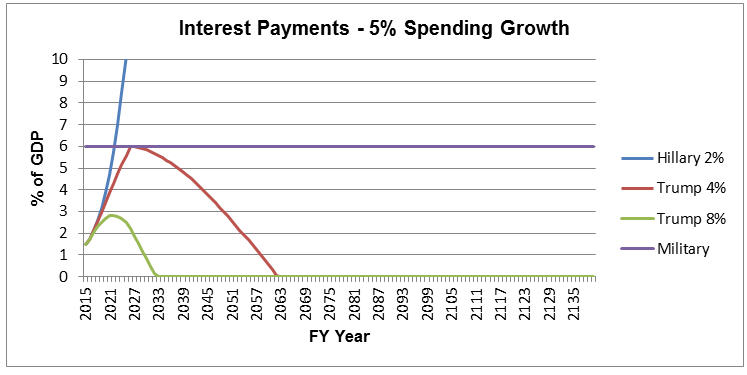
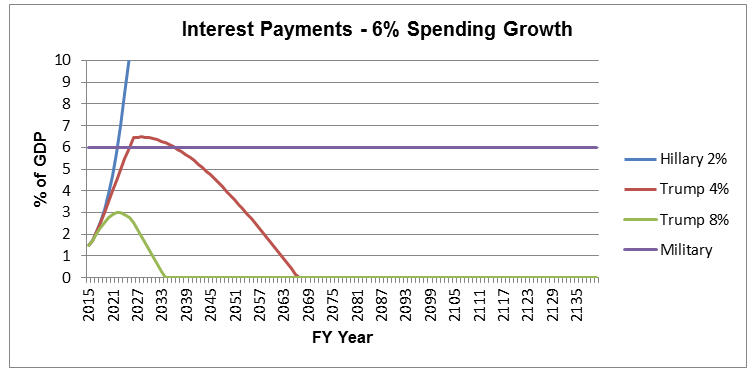
The following charts illustrate Interest Payments.
(0.0% Federal Funds Rate Growth)
(Hillary: 2.0% GDP Growth)
(Trump: 4.0% GDP Growth)
(Trump: 8.0% GDP Growth for Ten years then 4.0% thereafter)
 |
 |
 |
 |
 |
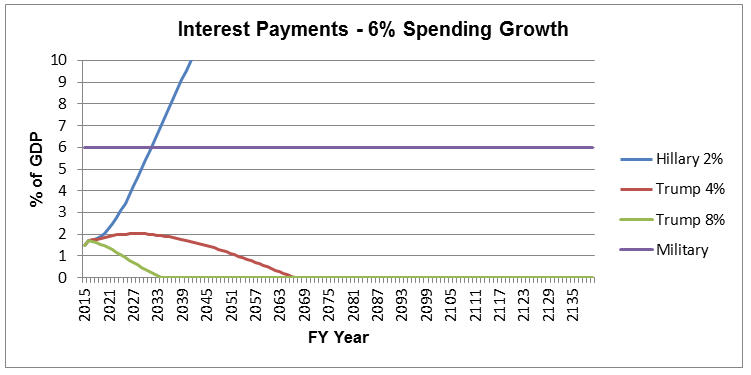 |
(Note: Scales for 4%, 5% and 6% changed to show more detail.)
The following charts illustrate Interest Payments.
(0.25% Federal Funds Rate Growth)
(Hillary: 2.0% GDP Growth)
(Trump: 4.0% GDP Growth)
(Trump: 8.0% GDP Growth for Ten years then 4.0% thereafter)
 |
 |
 |
 |
 |
 |
(Note: Scales for 4%, 5% and 6% changed to show more detail.)
The following charts illustrate Interest Payments.
(0.5% Federal Funds Rate Growth)
(Hillary: 2.0% GDP Growth)
(Trump: 4.0% GDP Growth)
(Trump: 8.0% GDP Growth for Ten years then 4.0% thereafter)
 |
 |
 |
 |
 |
 |
(Note: Scales for 4%, 5% and 6% changed to show more detail.)
For the Millennial, in the next ten years will your career advance? For Generation Z, is there a job out there for you now or in the next ten years? Will your wages increase? Will your children be better off than you? Will you be better off than your parents?
In the 1960’s, Kennedy accomplished 5% annual economic growth for nine years by reducing taxes and maintaining a strong dollar. In the 1980’s, Reagan accomplished the same, reducing taxes and maintaining a strong dollar, to create over 4% annual economic growth for almost 20 years.
The next president must not only accomplish at least a 4% annual economic growth, but accomplish more in order to eliminate the Debt for our future generations. The choice is the Liberal Progressives vision or the Conservatives vision for our future.
FairTax Implementation
I believe that the President along with Congress can implement the FairTax and replace the Income Tax by just passing laws. In that laws do not exist for implementing the Income tax then it can be easily removed by setting all the bracket rates to zero.
Congress could also reduce the corporate tax rate to zero while the States vote to repeal the 16th Amendment. Congress should propose an Amendment to repeal the 16th Amendment that would then be put before the individual States for approval.
|
|
|
In simple terms, Consumption is taxed and Investments are not taxed. For our nation to grow and prosper, private investment is the driving force. By not taxing investments, this is an incentive for the public to save and invest more.
Wages are tied to corporate tax rates: higher rates yield lower wages; lower rates yield higher wages. Eliminating corporate taxes will remove this correlation then wages will be based on productivity.
We get no tax revenues on imported products. At least states get sales tax revenue. We receive no taxes from foreign employees producing the products. We get no tax benefit from imports except for a little from companies that sale and deliver the products.
That’s will change under the FairTax!
|
|
|
All this for taxes collected as Consumption Tax of approximately 23%.
| Point 4: |
Will the rich pay less taxes with consumption tax than with income tax? Maybe, but that depends on how they spend their money: On Consumption or Investment. On the Income tax, they have deductions other don’t have which reduce the actual amount they pay. On the Consumption tax there are no deductions except for the non-taxed items that everyone gets. The rich will generally spend more on items that are taxed items: new homes, new cars, eating out in restaurants, etc. On the investment side, when individuals invest and the results are an increase in productivity or more jobs which in turn produces more consumption and more taxes. |
| Point 5: |
Will middle-class pay more with Consumption Tax or Income and FICA Taxes? Again depends, but generally with all the non-taxed items their taxes should be lower since the non-taxed items are mostly necessities of life and the taxed items are choices of life: new car versus pre-owned car and new home versus pre-owned home. |
|
|
|
Which is better for you: Income Tax or FairTax?
|
|
|
Learn what you can do to help save our Nation! Visit our Website Home Page!
Download - pdf Version
| DONATE TODAY! |
|