A Pamphlet from Don Stuart, Preserve Our Nation, LLC
Pamphlet #32 - 3/25/2010
Pass this pamphlet to your friends!
Donate to Our Cause
Part 2
GDP Economic Aggregate Supply and Aggregate Demand
How to view Recessions!
How to Recover from the Recession!
What is a recession? How do we recover from a recession? Is the government going in the right direction?
The Federal Government's goal is to balance the four measurements of the economic Gross Domestic Product (GDP). These measurements, sometimes referred to as the four corners of GDP, are low unemployment, low inflation, positive trade balance, and sustained economic growth.
It should be noted that achieving all of these at the same time is critical and difficult. There are even periods of time when not achieving one is desired. These will not be discussed in this pamphlet.
To understand these measurements, GDP is best analyzed using the Aggregate Supply and Aggregate Demand chart as shown below. This is a typical product supply-demand chart but instead of price, GDP is on the vertical axis and Units sold is on the horizontal axis. The curves represent the economic Aggregate Supply and the Aggregate Demand.
Aggregate Supply is the total accumulated manufacturing, services and structural dollars (See chart "Supply" - red line). Aggregate Demand is the total accumulated investments, consumer spending, government spending on products and services, and trade (See chart "Demand" - blue line). The Gross Domestic Product (GDP) occurs at the intersection of Aggregate Supply and Aggregate Demand (see chart - red/blue line intersection position marked with "A").
How are the Aggregate Supply, Aggregate Demand and GDP related to the four measurements: low inflation, low unemployment, trade, and growth? From the supply-demand chart below, many questions can be answered.
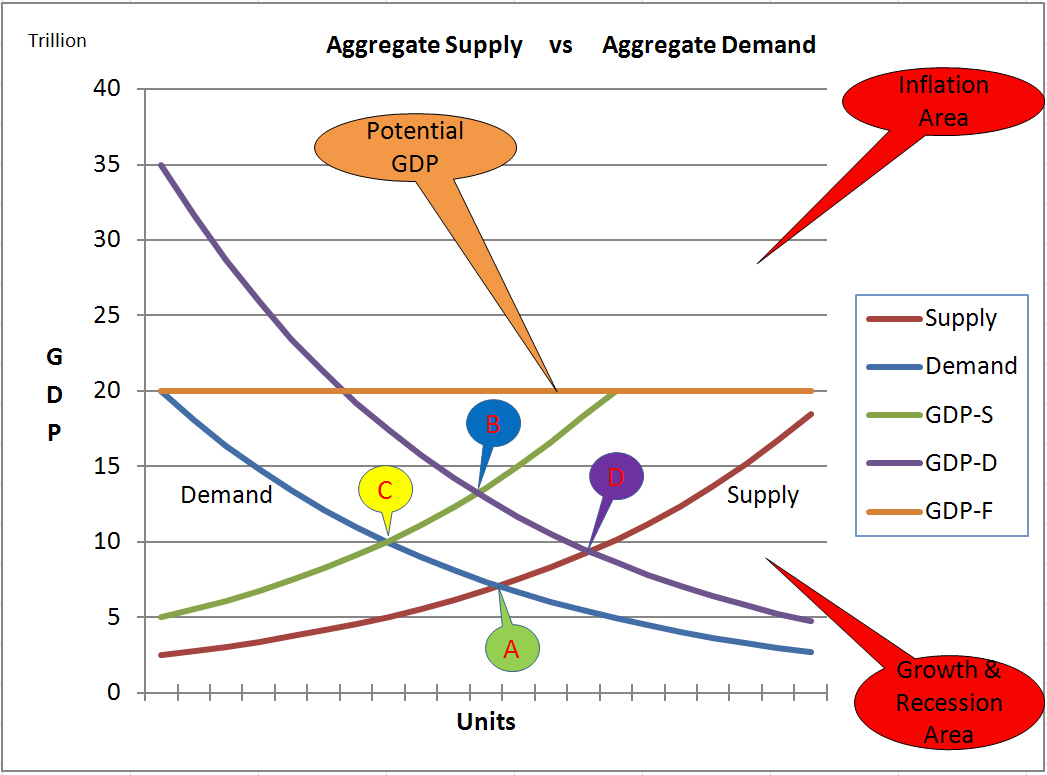
GDP Aggregate Supply-Aggregate Demand Curves
Potential GDP
A straight line is placed at $20 Trillion on the chart (See GDP-F curve - brown line). This line represents the Potential GDP (often referred to as Full Resources Employed GDP and denoted as GDP-F) where all resources have been maximized. This represents full employment of the labor supply, maximized investment of capital and maximized advanced technology for productivity increases.
Full employment means that there is no more available labor to be hired and no increase in productivity means that all technical advances have been exhausted. Capital investments dry up due to a lack of labor and lack of potential productivity increases. This line represents the "sweet spot" where Aggregate Supply, Aggregate Demand and Potential GDP meet at the same time: Full Employment, Maximum Productivity, and little Investment.
As the Aggregate Supply curve (Supply, GDP-S) and the Potential GDP lines (GDP-F) move up and down, the GDP grows or shrinks. So as production changes occur or productivity increases, the Potential GDP line will move upward and drag the Aggregate Supply curve with it. The Aggregate Supply curve can never be higher than the Potential GDP line.
In 2008, the GDP was 14.4 Trillion dollars as indicated by the intersection of the GDP-S and GDP-D curves (See position "B"). As of March 2010 the national unemployment rate is 9.7% and inflation is low at 2%. Why is this important and how is it related to the Aggregate Supply and Aggregate Demand curves?
Below the Potential GDP line, we can have positive and negative economic growth and recessions. Remember that a recession is defined as two consecutive quarters of negative growth. Depending on the view of the economy as discussed in a previous pamphlet, recessions can follow two paths of reducing GDP. The choice is either Jean-Baptiste Say's law which states that "Supply drives Demand" or John Maynard Keynes' Law which states that "Demand drives Supply." Keynes' Law prevails during short periods of time (years) whereas Say's Law is represented best over long periods of time (decades). As indicated in the previous pamphlet, using Say's law for short term recessions is the wrong choice.
In the following illustrations, curve positions are exaggerated for simplicity. GDP drops of 30% (as in Depression) are larger than today's real GDP drops of 5% to 10%. Also, this illustration utilizes one GDP drop of Aggregate Supply and Aggregate Demand whereas in the real economy, there will be many multiple smaller incremental drops over time.
Keynes' Law
As an example of Keynes' law, assume that the Aggregate Supply curve is stationary and that unemployment is constant and capital investments have vanished. Negative growth and recessions occur when the GDP drops as the Aggregate Demand curve slides downward.
Keynes' Law is illustrated by the Aggregate Demand curve sliding down from position "B" to position "C" on the chart. The GDP intersection is falling during this period of time from $14.4 Trillion to $10 Trillion. This reduction is due to the decrease in demand across the economy. As demand goes down, businesses will lay off employees thus reducing the Aggregate Supply in the economy. As this occurs, the Aggregate Supply curve GDP-S will slide down from position "C" to position "A", leveling off at $7 Trillion.
Say's Law
As an example of Say's view, the slide would start by the Aggregate Supply curve at position "B" sliding down to position "D" at $9 Trillion. This would indicate that businesses have cut production due to either loss of employees, loss of investment capital, loss of productivity, or higher manufacturing costs. An example of this is higher cost for raw materials. As jobs are lost, consumer demand will fall causing the Aggregate Demand curve to move from position "D" to position "A" at $7 Trillion.
We arrive at the same GDP position "A" no matter which path, Keynes' or Say's, is taken. The result is the same: negative growth or recession (negative growth for two quarters). The question now is what is the government going to do to reverse this course from GDP position "A" back to GDP position "B"? In other words, how is the economy going to grow back to GDP position "B"? The answer depends on the view of economics as predicted by the government in the previous pamphlet: "Are we to travel through GDP position "C" or GDP position "D"?"
Growth from GDP position "A" to GDP position "B" can again take either the Keynes' path or Say's path.
Keynes' Law
The Keynes' Law states that as demand (Household Investment, Consumer Spending, Government Spending, and Trade) increases, GDP moves from GDP position "A" to GDP position "D" as the Aggregate Demand curve moves upward. As demand increases, businesses will work to supply the products to consumers. As the supply increases, the GDP moves from GDP position "D" to GDP position "B".
Say's Law
Looking at the alternative, Say's Law states that as supply (manufacturing, services, structures) increases, GDP moves from GDP position "A" to GDP position "C". To increase the supply, businesses may have to hire more employees. An alternative for businesses is to work current employees longer hours or hire temporary employees. Typically, employers play a "wait and see philosophy" until they confirm the demand is real growth. People working will then push the Aggregate Demand curve upward, moving GDP from position "C" to position "B".
The question is "In the short term (years) which of the scenarios above will be most effective with an immediate response to promote growth out of a recession?" In other words, should government attack the economy via Keynes' Law or Say's Law? Does demand drive supply or does supply drive demand?
Which scenario do you think we are in today? Which method or path has the government utilized in order to stimulate the economy? Answer: By putting money into structures, government is trying to move the Aggregate Supply curve. The government is following Say's Law. The government is using long-term production solutions on short-term consumption problems.
A Big Mistake by the current administration! Now it could take a decade to restore us to previous GDP and economic growth rates and to reduce unemployment.
Learn what you can do to help save our Nation! Visit our Website Home Page!
Print this Page - Printable Version
| DONATE TODAY! |
|